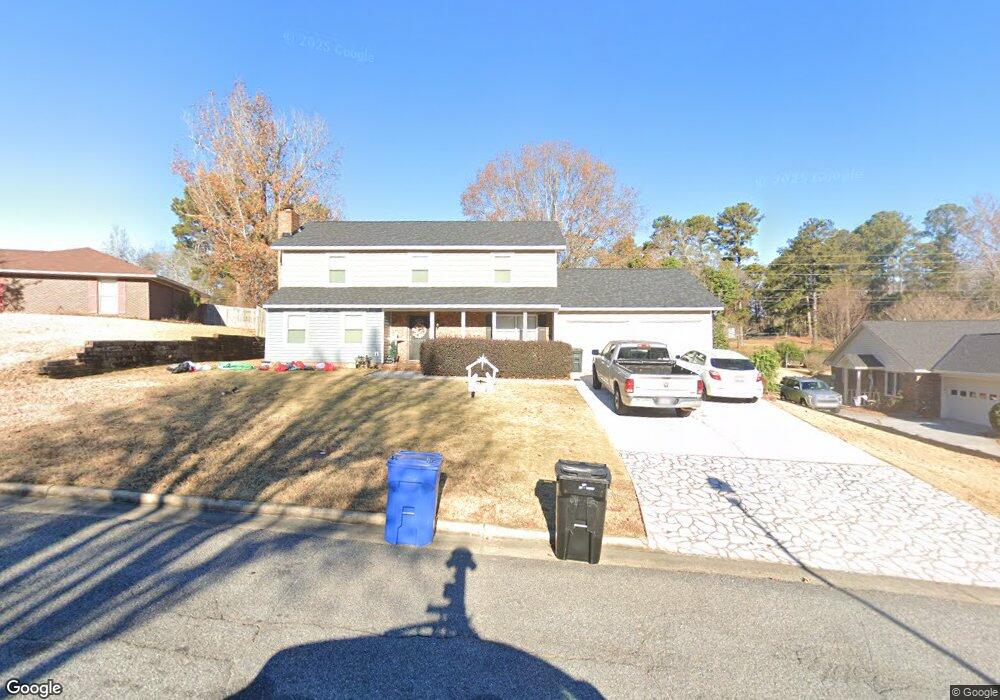
917 Lismore Dr Columbus, GA 31904
North Columbus NeighborhoodEstimated Value: $299,000 - $324,000
4
Beds
3
Baths
2,224
Sq Ft
$139/Sq Ft
Est. Value
About This Home
This home is located at 917 Lismore Dr, Columbus, GA 31904 and is currently estimated at $310,185, approximately $139 per square foot. 917 Lismore Dr is a home located in Muscogee County with nearby schools including River Road Elementary School, Double Churches Middle School, and Northside High School.
Ownership History
Date
Name
Owned For
Owner Type
Purchase Details
Closed on
Mar 25, 2013
Sold by
Knopf Patrick Carl
Bought by
Knopf Patrick C and Knopf Alecia
Current Estimated Value
Home Financials for this Owner
Home Financials are based on the most recent Mortgage that was taken out on this home.
Original Mortgage
$211,274
Outstanding Balance
$150,500
Interest Rate
3.75%
Mortgage Type
FHA
Estimated Equity
$159,685
Purchase Details
Closed on
Sep 24, 2008
Sold by
Pridmore George T and Pridmore Elizabeth M
Bought by
Knopf Patrick Carl and Knopf Alecia Clark
Home Financials for this Owner
Home Financials are based on the most recent Mortgage that was taken out on this home.
Original Mortgage
$222,166
Interest Rate
6.49%
Mortgage Type
FHA
Purchase Details
Closed on
Jun 13, 2007
Sold by
Sivel Jean P and Pridmore Jean L
Bought by
Pridmore George T and Pridmore Elizabeth M
Create a Home Valuation Report for This Property
The Home Valuation Report is an in-depth analysis detailing your home's value as well as a comparison with similar homes in the area
Home Values in the Area
Average Home Value in this Area
Purchase History
| Date | Buyer | Sale Price | Title Company |
|---|---|---|---|
| Knopf Patrick C | -- | -- | |
| Knopf Patrick Carl | $225,400 | None Available | |
| Pridmore George T | $250,000 | None Available |
Source: Public Records
Mortgage History
| Date | Status | Borrower | Loan Amount |
|---|---|---|---|
| Open | Knopf Patrick C | $211,274 | |
| Previous Owner | Knopf Patrick Carl | $222,166 |
Source: Public Records
Tax History Compared to Growth
Tax History
| Year | Tax Paid | Tax Assessment Tax Assessment Total Assessment is a certain percentage of the fair market value that is determined by local assessors to be the total taxable value of land and additions on the property. | Land | Improvement |
|---|---|---|---|---|
| 2025 | $2,949 | $92,772 | $18,464 | $74,308 |
| 2024 | $2,948 | $92,772 | $18,464 | $74,308 |
| 2023 | $2,272 | $92,772 | $18,464 | $74,308 |
| 2022 | $3,075 | $75,952 | $18,464 | $57,488 |
| 2021 | $3,068 | $73,816 | $18,464 | $55,352 |
| 2020 | $3,069 | $73,816 | $18,464 | $55,352 |
| 2019 | $3,080 | $73,816 | $18,464 | $55,352 |
| 2018 | $3,080 | $73,816 | $18,464 | $55,352 |
| 2017 | $3,092 | $73,816 | $18,464 | $55,352 |
| 2016 | $3,104 | $88,524 | $8,612 | $79,912 |
| 2015 | $3,109 | $88,524 | $8,612 | $79,912 |
| 2014 | $3,113 | $88,524 | $8,612 | $79,912 |
| 2013 | -- | $88,524 | $8,612 | $79,912 |
Source: Public Records
Map
Nearby Homes
- 16 Kylemore Ct
- 7233 Mobley Walk Dr
- 6333 Cape Cod Dr
- 6390 Cape Cod Dr
- 6969 Mobley Rd
- 6836 Sharmel Ln
- 235 Pebblebrook Ln
- 280 Zachary Ct
- 5 Bridgecreek Ct
- 1440 Blanchfield Dr
- 6130 Bristol Blvd
- 6825 Ellis Dr
- 6130 Brookstone Blvd
- 7047 Mellwood Rd
- 6802 Ellis Dr
- 7015 Spring Walk Dr
- 1355 Cloverdale Rd
- 252 Woodstream Dr
- 308 Woodstream Dr
- 264 Woodstream Dr
- 921 Lismore Dr
- 913 Lismore Dr
- 920 Lismore Dr
- 925 Lismore Dr
- 916 Lismore Dr
- 924 Lismore Dr
- 6682 Glenmore Way
- 6686 Glenmore Way
- 912 Lismore Dr
- 929 Lismore Dr
- 928 Lismore Dr
- 925 Mobley Rd
- 6700 Wynnridge Ct
- 902 Lismore Dr
- 933 Lismore Dr
- 932 Lismore Dr
- 6729 Ranch Forest Dr
- 8 Lismore Ct
- 6706 Wynnridge Ct
- 898 Lismore Dr