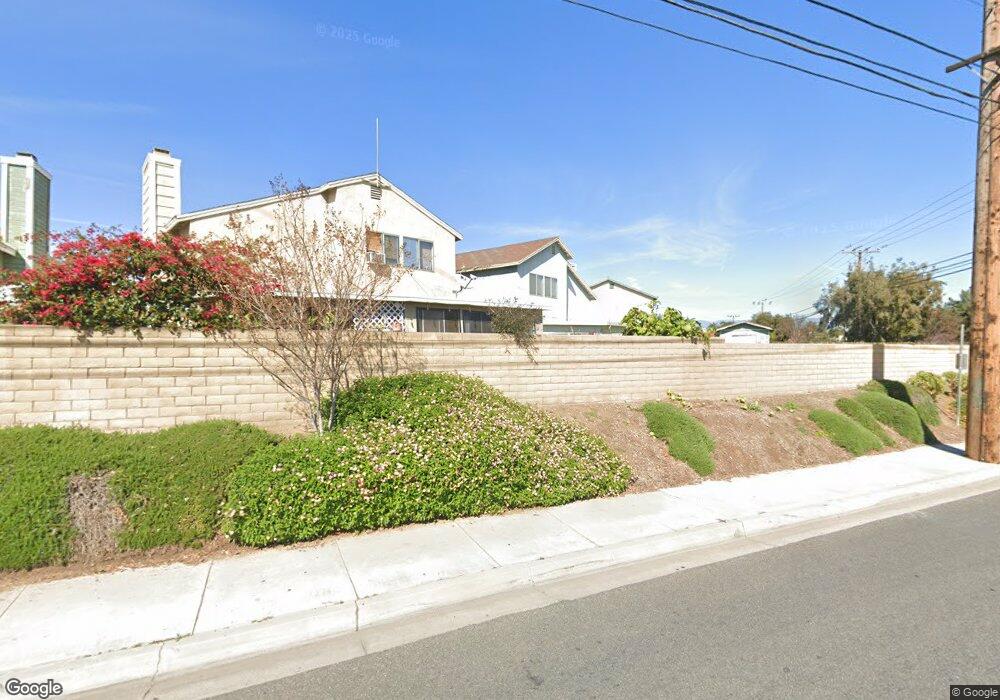
917 Manzanita St Bloomington, CA 92316
Estimated Value: $535,000 - $605,000
4
Beds
3
Baths
1,600
Sq Ft
$361/Sq Ft
Est. Value
About This Home
This home is located at 917 Manzanita St, Bloomington, CA 92316 and is currently estimated at $578,336, approximately $361 per square foot. 917 Manzanita St is a home located in San Bernardino County with nearby schools including Ruth Grimes Elementary School, Joe Baca, and Colton High School.
Ownership History
Date
Name
Owned For
Owner Type
Purchase Details
Closed on
Aug 31, 2006
Sold by
Amrull William K and Amrull Vera E
Bought by
Delacruz Francisco Javier and Delacruz Maria Isabel
Current Estimated Value
Home Financials for this Owner
Home Financials are based on the most recent Mortgage that was taken out on this home.
Original Mortgage
$385,000
Outstanding Balance
$239,893
Interest Rate
7.37%
Mortgage Type
Purchase Money Mortgage
Estimated Equity
$338,443
Purchase Details
Closed on
Jan 10, 2006
Sold by
Amrull William Karim and Amrull Vera Ellen
Bought by
Amrull William K and Amrull Vera E
Purchase Details
Closed on
Dec 10, 1993
Sold by
Cisneros Henry G
Bought by
Amrull William Karim and Amrull Vera Ellen
Home Financials for this Owner
Home Financials are based on the most recent Mortgage that was taken out on this home.
Original Mortgage
$97,396
Interest Rate
7.09%
Mortgage Type
FHA
Create a Home Valuation Report for This Property
The Home Valuation Report is an in-depth analysis detailing your home's value as well as a comparison with similar homes in the area
Home Values in the Area
Average Home Value in this Area
Purchase History
| Date | Buyer | Sale Price | Title Company |
|---|---|---|---|
| Delacruz Francisco Javier | $385,000 | United Title Company | |
| Amrull William K | -- | None Available | |
| Amrull William Karim | $98,500 | Continental Lawyers Title Co |
Source: Public Records
Mortgage History
| Date | Status | Borrower | Loan Amount |
|---|---|---|---|
| Open | Delacruz Francisco Javier | $385,000 | |
| Previous Owner | Amrull William Karim | $97,396 |
Source: Public Records
Tax History Compared to Growth
Tax History
| Year | Tax Paid | Tax Assessment Tax Assessment Total Assessment is a certain percentage of the fair market value that is determined by local assessors to be the total taxable value of land and additions on the property. | Land | Improvement |
|---|---|---|---|---|
| 2025 | $6,603 | $515,822 | $128,956 | $386,866 |
| 2024 | $6,603 | $505,707 | $126,427 | $379,280 |
| 2023 | $6,621 | $495,791 | $123,948 | $371,843 |
| 2022 | $5,964 | $443,200 | $155,000 | $288,200 |
| 2021 | $5,221 | $368,200 | $129,000 | $239,200 |
| 2020 | $4,627 | $318,200 | $111,200 | $207,000 |
| 2019 | $4,473 | $309,000 | $108,000 | $201,000 |
| 2018 | $4,427 | $306,000 | $75,000 | $231,000 |
| 2017 | $3,720 | $255,900 | $89,400 | $166,500 |
| 2016 | $3,368 | $243,700 | $85,100 | $158,600 |
| 2015 | $3,157 | $232,000 | $81,000 | $151,000 |
| 2014 | $3,109 | $232,000 | $81,000 | $151,000 |
Source: Public Records
Map
Nearby Homes
- 1154 S Spruce Ave
- 778 Bloomington Ave
- 703 W Montrose St
- 1228 W Woodcrest St
- 10022 Alameda Ave
- 756 W Fontlee Ln
- 9971 Cedar Ave
- 9967 Cedar Ave
- 9871 Magnolia St
- 18680 Grove Place
- 520 W Randall Ave
- 370 W San Bernardino Ave
- 314 W Manzanita St
- 200 W San Bernardino Ave Unit 58
- 200 W San Bernardino Ave Unit 132
- 200 W San Bernardino Ave Unit 19
- 200 W San Bernardino Ave Unit 85
- 200 W San Bernardino Ave Unit 47
- 200 W San Bernardino Ave Unit 69
- 200 W San Bernardino Ave Unit 100
- 927 Manzanita St
- 907 W Manzanita St
- 907 Manzanita St
- 937 Manzanita St
- 1297 S Spruce Ave
- 947 Manzanita St
- 1291 S Spruce Ave
- 1285 S Spruce Ave
- 957 Manzanita St
- 12271 S Spruce Ave
- 938 Manzanita St
- 1288 S Arrowhead Ave
- 1279 S Spruce Ave
- 967 Manzanita St
- 948 Manzanita St
- 1276 S Arrowhead Ave
- 958 Manzanita St
- 1275 S Spruce Ave
- 977 Manzanita St
- 968 Manzanita St