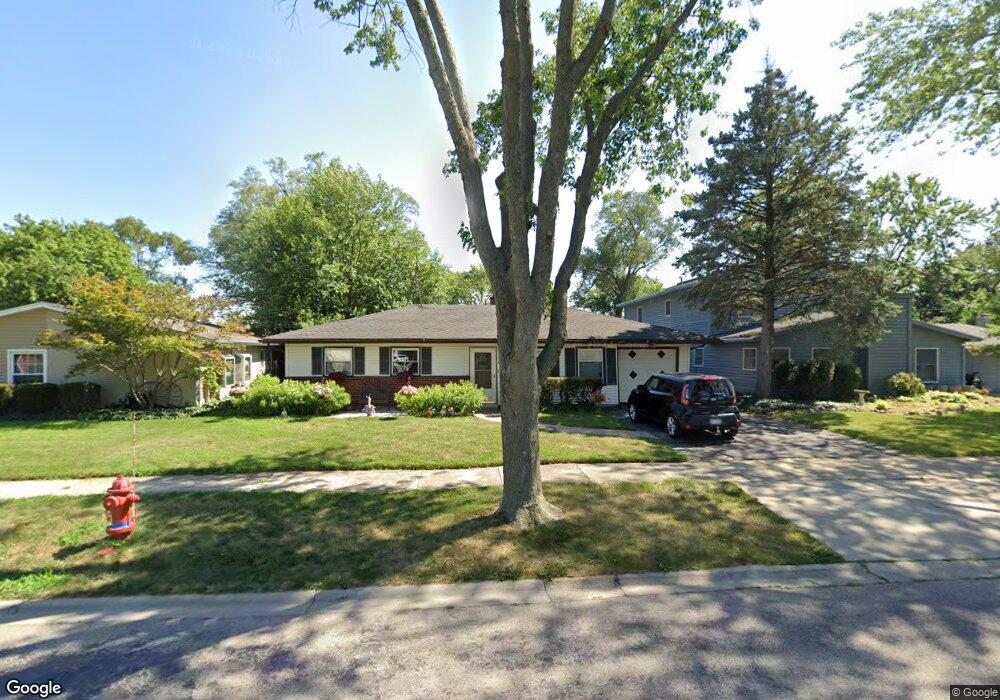
917 Pebble Dr Wheeling, IL 60090
Estimated Value: $344,000 - $355,000
3
Beds
2
Baths
1,127
Sq Ft
$308/Sq Ft
Est. Value
About This Home
This home is located at 917 Pebble Dr, Wheeling, IL 60090 and is currently estimated at $347,632, approximately $308 per square foot. 917 Pebble Dr is a home located in Cook County with nearby schools including Eugene Field Elementary School, Jack London Middle School, and Buffalo Grove High School.
Ownership History
Date
Name
Owned For
Owner Type
Purchase Details
Closed on
Sep 26, 2001
Sold by
Kurber Keith J
Bought by
Redmond Tommy L and Redmond Melissa L
Current Estimated Value
Home Financials for this Owner
Home Financials are based on the most recent Mortgage that was taken out on this home.
Original Mortgage
$173,550
Outstanding Balance
$65,384
Interest Rate
6.99%
Mortgage Type
FHA
Estimated Equity
$282,248
Purchase Details
Closed on
May 15, 1998
Sold by
Hansen Jeanette A
Bought by
Kurber Keith J
Home Financials for this Owner
Home Financials are based on the most recent Mortgage that was taken out on this home.
Original Mortgage
$154,000
Interest Rate
7.27%
Mortgage Type
VA
Purchase Details
Closed on
Aug 23, 1996
Sold by
Hansen Rina
Bought by
Hansen Rina and Hansen Jeanette A
Home Financials for this Owner
Home Financials are based on the most recent Mortgage that was taken out on this home.
Original Mortgage
$55,000
Interest Rate
8.3%
Create a Home Valuation Report for This Property
The Home Valuation Report is an in-depth analysis detailing your home's value as well as a comparison with similar homes in the area
Home Values in the Area
Average Home Value in this Area
Purchase History
| Date | Buyer | Sale Price | Title Company |
|---|---|---|---|
| Redmond Tommy L | $192,500 | -- | |
| Kurber Keith J | $151,000 | Professional National Title | |
| Hansen Rina | -- | Chicago Title Insurance Co |
Source: Public Records
Mortgage History
| Date | Status | Borrower | Loan Amount |
|---|---|---|---|
| Open | Redmond Tommy L | $173,550 | |
| Previous Owner | Kurber Keith J | $154,000 | |
| Previous Owner | Hansen Rina | $55,000 |
Source: Public Records
Tax History
| Year | Tax Paid | Tax Assessment Tax Assessment Total Assessment is a certain percentage of the fair market value that is determined by local assessors to be the total taxable value of land and additions on the property. | Land | Improvement |
|---|---|---|---|---|
| 2025 | $6,308 | $29,001 | $7,079 | $21,922 |
| 2024 | $6,308 | $22,139 | $5,899 | $16,240 |
| 2023 | $5,983 | $22,139 | $5,899 | $16,240 |
| 2022 | $5,983 | $22,139 | $5,899 | $16,240 |
| 2021 | $5,420 | $17,959 | $4,522 | $13,437 |
| 2020 | $5,361 | $17,959 | $4,522 | $13,437 |
| 2019 | $5,459 | $20,089 | $4,522 | $15,567 |
| 2018 | $5,121 | $17,467 | $3,932 | $13,535 |
| 2017 | $5,038 | $17,467 | $3,932 | $13,535 |
| 2016 | $5,805 | $19,895 | $3,932 | $15,963 |
| 2015 | $4,465 | $15,153 | $3,342 | $11,811 |
| 2014 | $4,374 | $15,153 | $3,342 | $11,811 |
| 2013 | $4,976 | $18,135 | $3,342 | $14,793 |
Source: Public Records
Map
Nearby Homes
- 148 Wilshire Dr
- 920 Valley Stream Dr
- 842 Colonial Dr Unit B
- 822 Colonial Dr Unit B
- 88 W Wayne Place
- 640 Mchenry Rd Unit 301
- 665 Cindy Ln
- 1059 Southbury Ln Unit 1
- 1052 Southbury Ln Unit 1
- 353 E Norman Ln
- 1321 Marcy Ln
- 550 Greystone Ln Unit A2
- 575 Greystone Ln Unit A2
- 416 Trinity Ct
- 350 E Dundee Rd Unit 207B
- 1410 Tulip Ct Unit D2
- 575 Fairway View Dr Unit 3E
- 1157 Middlebury Ln Unit 1
- 1051 Driftwood Ct Unit A2
- 492 Bernice Ct
Your Personal Tour Guide
Ask me questions while you tour the home.