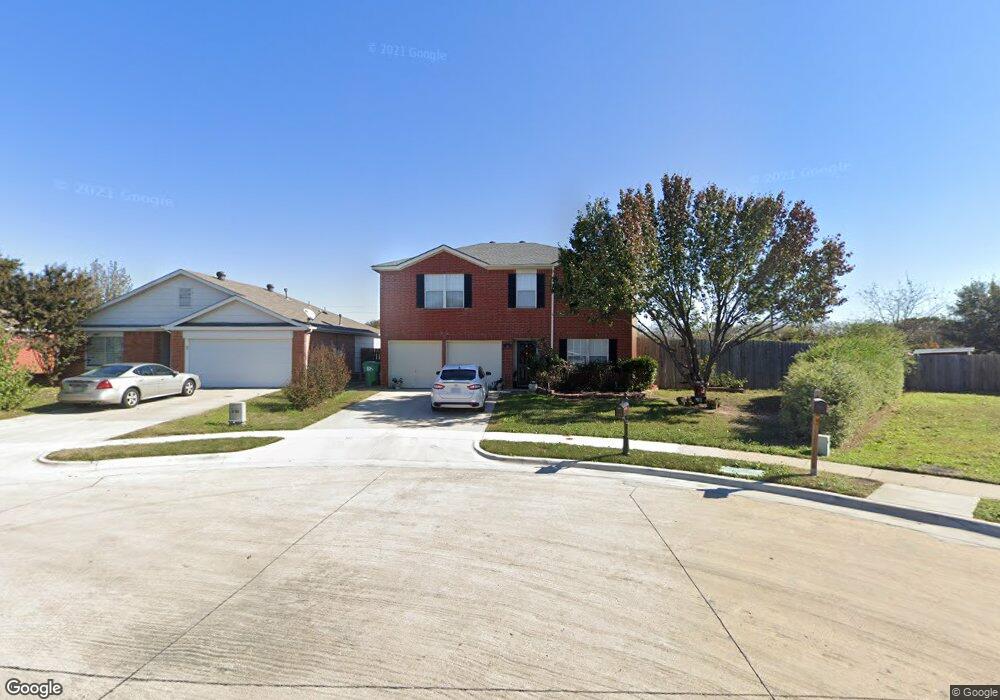
917 Springcreek Dr Denton, TX 76210
South Denton NeighborhoodEstimated Value: $281,000 - $313,000
4
Beds
3
Baths
1,606
Sq Ft
$189/Sq Ft
Est. Value
About This Home
This home is located at 917 Springcreek Dr, Denton, TX 76210 and is currently estimated at $302,896, approximately $188 per square foot. 917 Springcreek Dr is a home located in Denton County with nearby schools including Ryan Elementary School, McMath Middle School, and Denton High School.
Ownership History
Date
Name
Owned For
Owner Type
Purchase Details
Closed on
Aug 30, 2010
Sold by
Sheppard Travis and Miller Linda
Bought by
Feyereisen Sandra and Feyereisen Robert
Current Estimated Value
Home Financials for this Owner
Home Financials are based on the most recent Mortgage that was taken out on this home.
Original Mortgage
$121,365
Outstanding Balance
$81,393
Interest Rate
4.75%
Mortgage Type
FHA
Estimated Equity
$221,503
Purchase Details
Closed on
Jun 7, 2004
Sold by
Mcnairy William D and Mcnairy Robie J
Bought by
Sheppard Travis and Miller Linda
Home Financials for this Owner
Home Financials are based on the most recent Mortgage that was taken out on this home.
Original Mortgage
$124,019
Interest Rate
6.02%
Mortgage Type
FHA
Purchase Details
Closed on
Dec 11, 1998
Sold by
Pulte Homes Of Texas Lp
Bought by
Mcnairy William D and Mcnairy Robie J
Home Financials for this Owner
Home Financials are based on the most recent Mortgage that was taken out on this home.
Original Mortgage
$101,348
Interest Rate
6.87%
Mortgage Type
FHA
Create a Home Valuation Report for This Property
The Home Valuation Report is an in-depth analysis detailing your home's value as well as a comparison with similar homes in the area
Home Values in the Area
Average Home Value in this Area
Purchase History
| Date | Buyer | Sale Price | Title Company |
|---|---|---|---|
| Feyereisen Sandra | -- | None Available | |
| Sheppard Travis | -- | Sierra Title | |
| Mcnairy William D | -- | -- |
Source: Public Records
Mortgage History
| Date | Status | Borrower | Loan Amount |
|---|---|---|---|
| Open | Feyereisen Sandra | $121,365 | |
| Previous Owner | Sheppard Travis | $124,019 | |
| Previous Owner | Mcnairy William D | $101,348 |
Source: Public Records
Tax History
| Year | Tax Paid | Tax Assessment Tax Assessment Total Assessment is a certain percentage of the fair market value that is determined by local assessors to be the total taxable value of land and additions on the property. | Land | Improvement |
|---|---|---|---|---|
| 2025 | $2,109 | $280,783 | $73,909 | $206,874 |
| 2024 | $5,083 | $263,359 | $0 | $0 |
| 2023 | $2,112 | $239,417 | $73,909 | $233,761 |
| 2022 | $4,620 | $217,652 | $73,909 | $187,651 |
| 2021 | $4,399 | $197,865 | $46,190 | $151,675 |
| 2020 | $4,563 | $199,615 | $46,190 | $153,425 |
| 2019 | $4,725 | $198,010 | $46,190 | $151,820 |
| 2018 | $4,407 | $182,453 | $46,190 | $139,079 |
| 2017 | $4,100 | $165,866 | $46,190 | $126,834 |
| 2016 | $3,590 | $150,787 | $32,993 | $118,958 |
| 2015 | $2,889 | $137,079 | $32,993 | $104,086 |
| 2013 | -- | $114,625 | $26,394 | $88,231 |
Source: Public Records
Map
Nearby Homes
- 3117 Kappwood Ct
- 400 Saratoga Dr
- 301 Fairmount Ct
- 3309 Del Mar Dr
- 3109 Pecan Tree Dr
- 409 Meadowlands Dr
- 3504 Belmont St
- 309 Sanders Rd
- 1108 Central Village Dr
- 3200 Belmont St
- 3304 Teasbend Ct
- 109 Visalia Ln
- 109 Meadowlands Dr
- 21 Wellington Oaks Cir
- 27 Wellington Oaks Cir
- 44 Wellington Oaks Cir
- 109 Red Fox Ln
- 3109 Forrestridge Dr
- 5501 Cypress Point Dr
- 5500 Nelson Pkwy
- 913 Springcreek Dr
- 921 Springcreek Dr
- 909 Springcreek Dr
- 925 Springcreek Dr
- 905 Springcreek Dr
- 928 Springcreek Dr
- 929 Springcreek Dr
- 901 Springcreek Dr
- 932 Springcreek Dr
- 933 Springcreek Dr
- 913 Beechwood Dr
- 936 Springcreek Dr
- 937 Springcreek Dr
- 917 Beechwood Dr
- 940 Springcreek Dr
- 921 Beechwood Dr
- 941 Springcreek Dr
- 900 Beechwood Dr
- 904 Beechwood Dr
- 925 Beechwood Dr
Your Personal Tour Guide
Ask me questions while you tour the home.