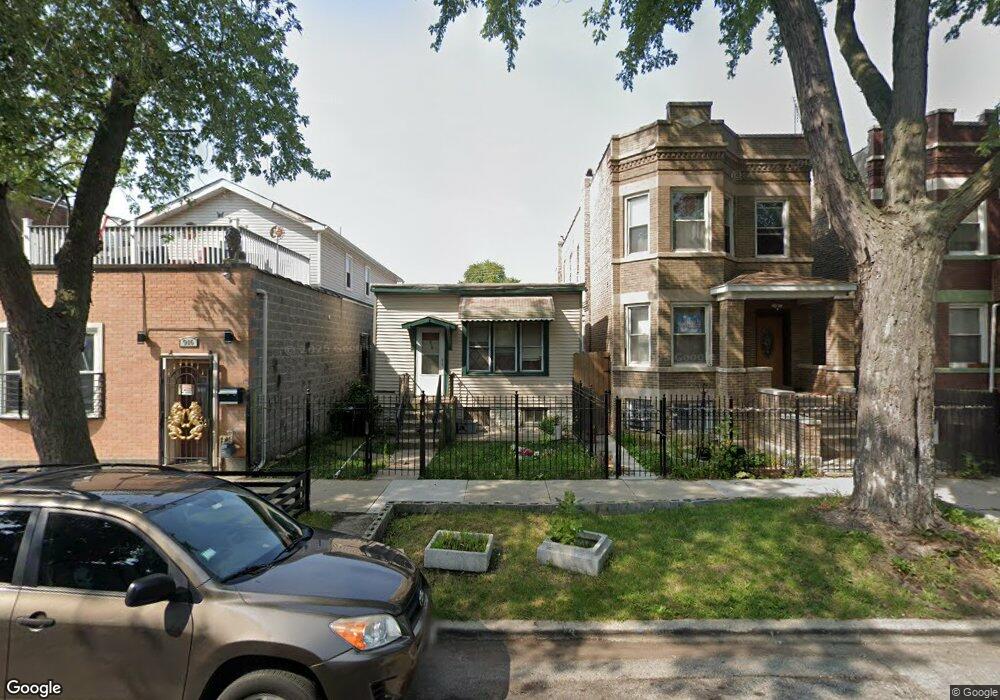
918 N Ridgeway Ave Chicago, IL 60651
Humboldt Park NeighborhoodEstimated Value: $191,000 - $224,000
3
Beds
1
Bath
837
Sq Ft
$254/Sq Ft
Est. Value
About This Home
This home is located at 918 N Ridgeway Ave, Chicago, IL 60651 and is currently estimated at $212,184, approximately $253 per square foot. 918 N Ridgeway Ave is a home located in Cook County with nearby schools including Cameron Elementary School, Orr Academy High School, and KIPP One Academy.
Ownership History
Date
Name
Owned For
Owner Type
Purchase Details
Closed on
Apr 5, 2011
Sold by
Carroll Lynn
Bought by
Bencomo Caridad
Current Estimated Value
Purchase Details
Closed on
Dec 16, 2009
Sold by
Deutsche Bank National Trust Company
Bought by
Carroll Lynn
Purchase Details
Closed on
Jun 8, 2009
Sold by
Burgos
Bought by
Deutsche Bank National Trust Company
Purchase Details
Closed on
May 21, 2007
Sold by
Park National Bank
Bought by
Burgos Jose
Home Financials for this Owner
Home Financials are based on the most recent Mortgage that was taken out on this home.
Original Mortgage
$215,650
Interest Rate
6.2%
Mortgage Type
Purchase Money Mortgage
Purchase Details
Closed on
Oct 20, 2006
Sold by
Prude Jonnette L
Bought by
Park National Bank and Trust #31103
Purchase Details
Closed on
Jun 18, 2004
Sold by
Prude Jonnette L
Bought by
Bell Clara
Create a Home Valuation Report for This Property
The Home Valuation Report is an in-depth analysis detailing your home's value as well as a comparison with similar homes in the area
Home Values in the Area
Average Home Value in this Area
Purchase History
| Date | Buyer | Sale Price | Title Company |
|---|---|---|---|
| Bencomo Caridad | -- | None Available | |
| Carroll Lynn | $15,500 | Cti | |
| Deutsche Bank National Trust Company | -- | None Available | |
| Burgos Jose | $227,000 | None Available | |
| Park National Bank | $90,000 | Alliance Title Company | |
| Bell Clara | $165,000 | Ticor |
Source: Public Records
Mortgage History
| Date | Status | Borrower | Loan Amount |
|---|---|---|---|
| Previous Owner | Burgos Jose | $215,650 |
Source: Public Records
Tax History
| Year | Tax Paid | Tax Assessment Tax Assessment Total Assessment is a certain percentage of the fair market value that is determined by local assessors to be the total taxable value of land and additions on the property. | Land | Improvement |
|---|---|---|---|---|
| 2025 | $1,488 | $17,200 | $5,781 | $11,419 |
| 2024 | $1,488 | $17,200 | $5,781 | $11,419 |
| 2023 | $956 | $13,001 | $4,688 | $8,313 |
| 2022 | $956 | $13,001 | $4,688 | $8,313 |
| 2021 | $910 | $12,999 | $4,687 | $8,312 |
| 2020 | $801 | $9,801 | $3,671 | $6,130 |
| 2019 | $810 | $10,891 | $3,671 | $7,220 |
| 2018 | $794 | $10,891 | $3,671 | $7,220 |
| 2017 | $794 | $10,438 | $3,281 | $7,157 |
| 2016 | $1,233 | $10,438 | $3,281 | $7,157 |
| 2015 | $1,432 | $10,438 | $3,281 | $7,157 |
| 2014 | $1,342 | $9,804 | $3,125 | $6,679 |
| 2013 | $1,305 | $9,804 | $3,125 | $6,679 |
Source: Public Records
Map
Nearby Homes
- 1010 N Ridgeway Ave
- 921 N Avers Ave
- 931 N Lawndale Ave
- 1028 N Hamlin Ave
- 1041 N Ridgeway Ave
- 1029 N Avers Ave
- 822 N Lawndale Ave
- 820 N Monticello Ave
- 943 N Central Park Ave
- 1032 N Springfield Ave
- 1121 N Lawndale Ave
- 942 N Harding Ave
- 1018 N Harding Ave
- 921 N Drake Ave
- 903 N Drake Ave
- 1015 N Pulaski Rd
- 3546 W Chicago Ave
- 711 N Ridgeway Ave
- 727 N Springfield Ave
- 924 N Pulaski Rd
- 920 N Ridgeway Ave Unit 1
- 920 N Ridgeway Ave
- 916 N Ridgeway Ave
- 912 N Ridgeway Ave
- 922 N Ridgeway Ave
- 910 N Ridgeway Ave
- 926 N Ridgeway Ave
- 928 N Ridgeway Ave
- 928 N Ridgeway Ave
- 908 N Ridgeway Ave
- 904 N Ridgeway Ave
- 930 N Ridgeway Ave
- 919 N Hamlin Ave
- 919 N Hamlin Ave
- 915 N Hamlin Ave
- 921 N Hamlin Ave
- 902 N Ridgeway Ave
- 913 N Hamlin Ave
- 923 N Hamlin Ave
- 923 N Hamlin Ave
Your Personal Tour Guide
Ask me questions while you tour the home.