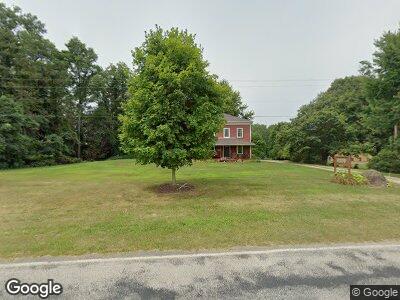
9185 State St Kinsman, OH 44428
Estimated Value: $217,000 - $301,000
3
Beds
1
Bath
2,512
Sq Ft
$104/Sq Ft
Est. Value
About This Home
This home is located at 9185 State St, Kinsman, OH 44428 and is currently estimated at $261,967, approximately $104 per square foot. 9185 State St is a home located in Trumbull County with nearby schools including Badger Elementary School, Badger Middle School, and Badger High School.
Ownership History
Date
Name
Owned For
Owner Type
Purchase Details
Closed on
Jun 4, 2010
Sold by
Sloan Jonathan R and Sloan Rebecca S
Bought by
Sloan Jonathan R
Current Estimated Value
Home Financials for this Owner
Home Financials are based on the most recent Mortgage that was taken out on this home.
Original Mortgage
$92,000
Interest Rate
4.32%
Mortgage Type
New Conventional
Purchase Details
Closed on
Feb 12, 2002
Sold by
Bank One Na
Bought by
Sloan Jonathan R and Sloan Rebecca S
Home Financials for this Owner
Home Financials are based on the most recent Mortgage that was taken out on this home.
Original Mortgage
$109,200
Interest Rate
7.24%
Mortgage Type
New Conventional
Purchase Details
Closed on
Oct 9, 2001
Sold by
Hurlbert H Mark and Hurlbert Karen
Bought by
Bank One Na
Purchase Details
Closed on
Mar 25, 1994
Sold by
Ruth Ralph H and Ruth M
Bought by
Mark Hurlbert J H and Hur S Stephanie L
Purchase Details
Closed on
Jan 1, 1990
Bought by
Ruth Ralph H and Ruth M
Create a Home Valuation Report for This Property
The Home Valuation Report is an in-depth analysis detailing your home's value as well as a comparison with similar homes in the area
Home Values in the Area
Average Home Value in this Area
Purchase History
| Date | Buyer | Sale Price | Title Company |
|---|---|---|---|
| Sloan Jonathan R | -- | New England Title | |
| Sloan Jonathan R | $115,000 | -- | |
| Mark Hurlbert J H | $78,000 | -- | |
| Ruth Ralph H | -- | -- |
Source: Public Records
Mortgage History
| Date | Status | Borrower | Loan Amount |
|---|---|---|---|
| Open | Sloan Jonathan R | $72,000 | |
| Closed | Sloan Jonathan R | $97,700 | |
| Closed | Sloan Jonathan R | $92,000 | |
| Closed | Sloan Jonathan R | $10,000 | |
| Closed | Bank One Na | $109,200 |
Source: Public Records
Tax History Compared to Growth
Tax History
| Year | Tax Paid | Tax Assessment Tax Assessment Total Assessment is a certain percentage of the fair market value that is determined by local assessors to be the total taxable value of land and additions on the property. | Land | Improvement |
|---|---|---|---|---|
| 2023 | $3,366 | $73,860 | $4,660 | $69,200 |
| 2022 | $2,739 | $53,660 | $4,310 | $49,350 |
| 2021 | $2,740 | $53,660 | $4,310 | $49,350 |
| 2020 | $2,723 | $53,660 | $4,310 | $49,350 |
| 2019 | $2,176 | $41,300 | $3,990 | $37,310 |
| 2018 | $2,180 | $41,300 | $3,990 | $37,310 |
| 2017 | $2,175 | $41,300 | $3,990 | $37,310 |
| 2016 | $2,018 | $38,610 | $3,570 | $35,040 |
| 2015 | $1,863 | $35,740 | $3,570 | $32,170 |
| 2014 | $1,808 | $35,740 | $3,570 | $32,170 |
| 2013 | $1,910 | $35,740 | $3,570 | $32,170 |
Source: Public Records
Map
Nearby Homes
- 5845 Burton Bloomfield
- 8638 Youngstown Conneaut Rd
- 5921 Mayburn Barclay Rd
- 9758 Kinsman Pymatuning Rd
- 6563 County Line Rd
- 8517 State Route 7
- 9960 Ridge Rd
- 8074 State Route 7
- 7724 Stanhope-Kelloggsville Rd
- 5372 Slater Rd
- 549 Kinsman Rd
- 7433 State Route 7
- 6027 & 6515 Oh-88
- 3143 U S 322
- 7833 Pymatuning Lake Rd
- 8122 Oak St
- 0 Bushnell Campbell Rd
- 6416 State Route 88
- 7280 Old Us Route 322
- 6790 Slater Rd
- 9185 State St
- 9147 State St
- 9043 State St
- 8990 State (Stanhope-Kelloggsville) Rd
- 9471 State St
- 9491 State St
- 9323 Ridge Rd
- 9323 Ridge Rd
- 9503 State St
- 9500 State St
- 6106 Webber Cole Rd
- 9239 Ridge Rd
- 6076 Webber Cole Rd
- 6118 Webber Cole Rd
- 9354 Ridge Rd
- 9292 Ridge Rd
- 9258 Ridge Rd
- 8845 State St
- 6105 Webber Cole Rd
- 9486 Ridge Rd