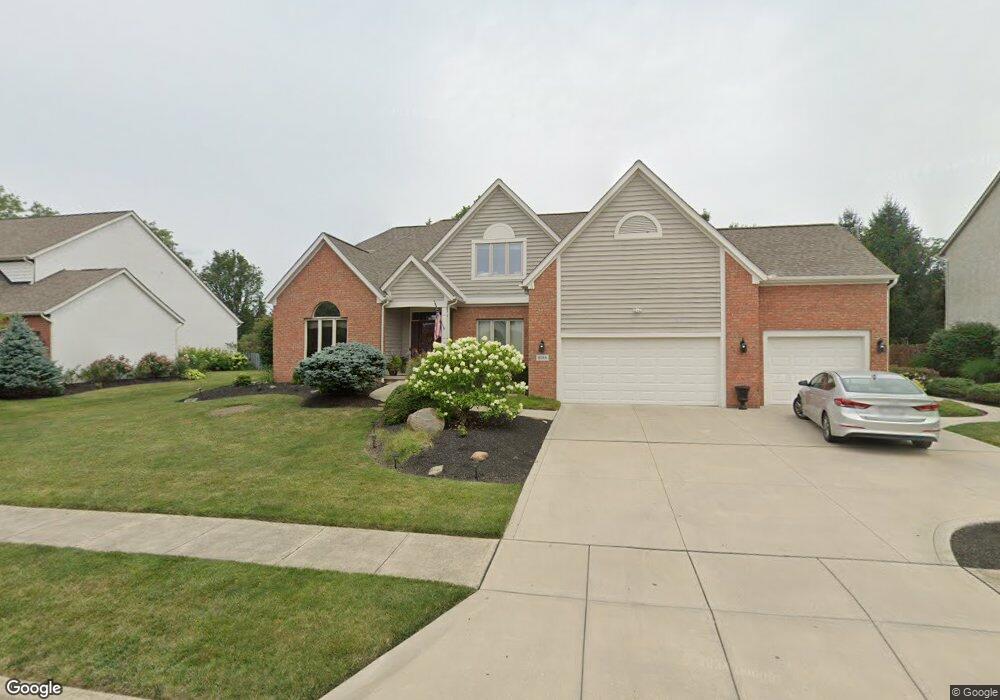
9188 Candleridge St Unit 126 Pickerington, OH 43147
Estimated Value: $576,000 - $613,081
4
Beds
3
Baths
3,029
Sq Ft
$197/Sq Ft
Est. Value
About This Home
This home is located at 9188 Candleridge St Unit 126, Pickerington, OH 43147 and is currently estimated at $597,020, approximately $197 per square foot. 9188 Candleridge St Unit 126 is a home located in Fairfield County with nearby schools including Violet Elementary School, Harmon Middle School, and Pickerington Lakeview Junior High School.
Ownership History
Date
Name
Owned For
Owner Type
Purchase Details
Closed on
May 18, 2018
Sold by
Hohnberger Craig Jay and Craig Jay Hohnberger Revocable
Bought by
Widrig Jeffrey and Widrig Sarah
Current Estimated Value
Home Financials for this Owner
Home Financials are based on the most recent Mortgage that was taken out on this home.
Original Mortgage
$298,800
Outstanding Balance
$257,277
Interest Rate
4.4%
Mortgage Type
Future Advance Clause Open End Mortgage
Estimated Equity
$339,743
Purchase Details
Closed on
May 23, 2014
Sold by
Hohnberger Craig J and Hohnberger Annette L
Bought by
Hohnberger Craig Jay and The Craig Jay Hohnberger Revoc
Purchase Details
Closed on
Jun 22, 2000
Sold by
Donley Inc
Bought by
Hohnberger Craig J and Hohnberger Annette L
Home Financials for this Owner
Home Financials are based on the most recent Mortgage that was taken out on this home.
Original Mortgage
$240,000
Interest Rate
8.56%
Mortgage Type
New Conventional
Create a Home Valuation Report for This Property
The Home Valuation Report is an in-depth analysis detailing your home's value as well as a comparison with similar homes in the area
Home Values in the Area
Average Home Value in this Area
Purchase History
| Date | Buyer | Sale Price | Title Company |
|---|---|---|---|
| Widrig Jeffrey | $373,500 | None Available | |
| Hohnberger Craig Jay | -- | Attorney | |
| Hohnberger Craig J | $310,000 | -- |
Source: Public Records
Mortgage History
| Date | Status | Borrower | Loan Amount |
|---|---|---|---|
| Open | Widrig Jeffrey | $298,800 | |
| Previous Owner | Hohnberger Craig J | $240,000 |
Source: Public Records
Tax History Compared to Growth
Tax History
| Year | Tax Paid | Tax Assessment Tax Assessment Total Assessment is a certain percentage of the fair market value that is determined by local assessors to be the total taxable value of land and additions on the property. | Land | Improvement |
|---|---|---|---|---|
| 2024 | $16,282 | $137,400 | $22,860 | $114,540 |
| 2023 | $6,251 | $137,400 | $22,860 | $114,540 |
| 2022 | $6,329 | $137,400 | $22,860 | $114,540 |
| 2021 | $6,227 | $116,240 | $20,780 | $95,460 |
| 2020 | $6,296 | $116,240 | $20,780 | $95,460 |
| 2019 | $6,336 | $116,240 | $20,780 | $95,460 |
| 2018 | $7,126 | $109,440 | $20,780 | $88,660 |
| 2017 | $7,135 | $114,190 | $19,990 | $94,200 |
| 2016 | $7,095 | $114,190 | $19,990 | $94,200 |
| 2015 | $7,049 | $109,930 | $19,990 | $89,940 |
| 2014 | $6,958 | $109,930 | $19,990 | $89,940 |
| 2013 | $6,958 | $109,930 | $19,990 | $89,940 |
Source: Public Records
Map
Nearby Homes
- 12965 Silverbrook Dr
- 9170 Bridle Terrace
- 8869 Chevington Chase Dr
- 9230 Blacklick-Eastern Rd NW
- 8294 Morgan St
- 9538 Timberbank Cir
- 13048 Coventry Ave
- 9756 Camelot St NW
- 8738 Birch Brook Loop NW
- 8782 Stonehenge Dr NW
- 12394 Bentwood Farms Dr
- 8458 Chesapeake Way NW
- 11577 Coventry Ave
- 13070 E Crosset Hill Dr
- 13137 E Crosset Hill Dr
- 12316 Thoroughbred Dr
- 12278 Butterfield Dr
- 13297 White Cross Dr NW
- 13068 Rustic Dr
- 12008 Sheldrake Ct
- 9188 Candleridge St
- 9170 Candleridge St
- 9206 Candleridge St
- 9187 Cotswold Dr
- 9169 Cotswold Dr
- 9152 Candleridge St
- 9189 Candleridge St
- 9205 Cotswold Dr
- 9171 Candleridge St
- 9207 Candleridge St
- 13127 Silver Brook Dr
- 13149 Silver Brook Dr
- 9151 Cotswold Dr
- 0 Cotswold Dr Unit L 57
- 13127 Silverbrook Dr
- 9153 Candleridge St
- 13185 Silver Brook Dr
- 13109 Silver Brook Dr
- 9134 Candleridge St
- 9164 Cotswold Dr Unit L56