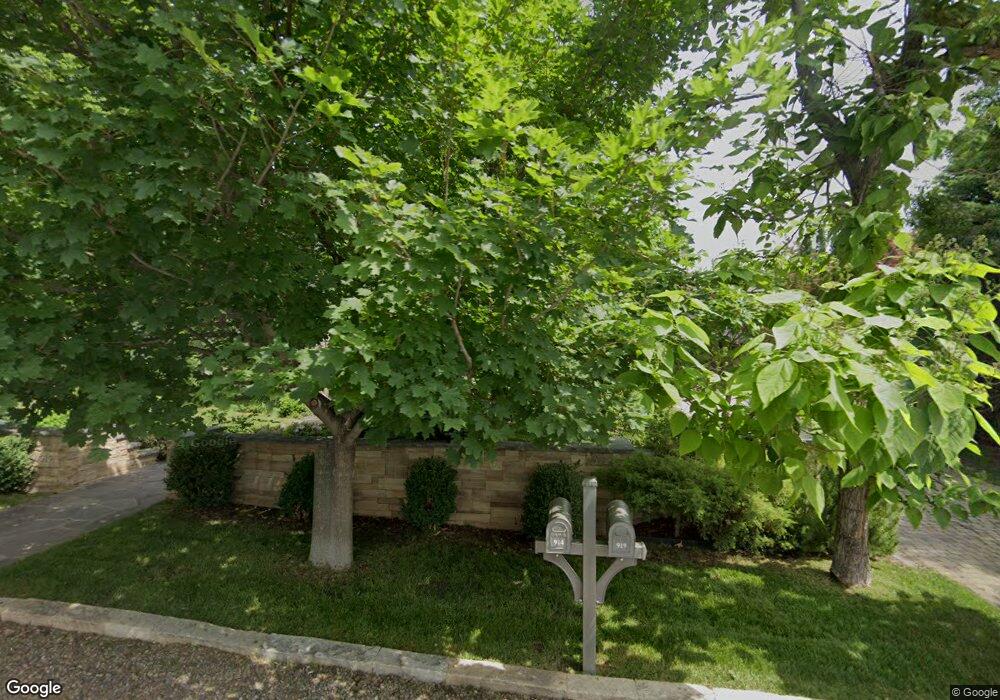
919 Juniper Ave Boulder, CO 80304
Newlands NeighborhoodEstimated Value: $4,999,000 - $5,578,000
4
Beds
2
Baths
2,239
Sq Ft
$2,398/Sq Ft
Est. Value
About This Home
This home is located at 919 Juniper Ave, Boulder, CO 80304 and is currently estimated at $5,369,756, approximately $2,398 per square foot. 919 Juniper Ave is a home located in Boulder County with nearby schools including Foothill Elementary School, Centennial Middle School, and Boulder High School.
Ownership History
Date
Name
Owned For
Owner Type
Purchase Details
Closed on
Jul 1, 2014
Sold by
Gould Gordon and Gould Catherine
Bought by
Gould Gordon
Current Estimated Value
Purchase Details
Closed on
Oct 31, 2005
Sold by
Wienbroeer Ralph W and Wienbroeer Faye C
Bought by
Gould Gordon
Home Financials for this Owner
Home Financials are based on the most recent Mortgage that was taken out on this home.
Original Mortgage
$625,000
Outstanding Balance
$339,512
Interest Rate
5.9%
Mortgage Type
Fannie Mae Freddie Mac
Estimated Equity
$5,030,244
Create a Home Valuation Report for This Property
The Home Valuation Report is an in-depth analysis detailing your home's value as well as a comparison with similar homes in the area
Home Values in the Area
Average Home Value in this Area
Purchase History
| Date | Buyer | Sale Price | Title Company |
|---|---|---|---|
| Gould Gordon | -- | None Available | |
| Gould Gordon | $925,000 | Security Title |
Source: Public Records
Mortgage History
| Date | Status | Borrower | Loan Amount |
|---|---|---|---|
| Open | Gould Gordon | $625,000 |
Source: Public Records
Tax History Compared to Growth
Tax History
| Year | Tax Paid | Tax Assessment Tax Assessment Total Assessment is a certain percentage of the fair market value that is determined by local assessors to be the total taxable value of land and additions on the property. | Land | Improvement |
|---|---|---|---|---|
| 2025 | $38,733 | $470,225 | $166,294 | $303,931 |
| 2024 | $38,733 | $470,225 | $166,294 | $303,931 |
| 2023 | $38,061 | $440,726 | $184,304 | $260,107 |
| 2022 | $35,996 | $387,623 | $132,356 | $255,267 |
| 2021 | $34,325 | $398,777 | $136,165 | $262,612 |
| 2020 | $27,783 | $319,184 | $132,919 | $186,265 |
| 2019 | $27,358 | $319,184 | $132,919 | $186,265 |
| 2018 | $25,254 | $291,276 | $126,288 | $164,988 |
| 2017 | $24,463 | $349,093 | $139,618 | $209,475 |
| 2016 | $18,881 | $218,112 | $87,242 | $130,870 |
| 2015 | $17,879 | $153,334 | $51,820 | $101,514 |
| 2014 | $12,892 | $153,334 | $51,820 | $101,514 |
Source: Public Records
Map
Nearby Homes
- 910 Kalmia Ave
- 800 Kalmia Ave
- 855 Kalmia Ave
- 1127 Juniper Ave
- 1070 Juniper Ave
- 706 Juniper Ave
- 1172 Juniper Ave
- 864 Iris Ave
- 3319 Broadway
- 711 Hawthorn Ave
- 640 Iris Ave
- 503 Kalmia Ave
- 3360 Broadway St
- 3315 Broadway St
- 1400 Kalmia Ave
- 560 Iris Ave
- 550 Iris Ave
- 440 Japonica Way
- 3747 Mountain Laurel Place
- 3561 4th St
- 1011 Juniper Ave
- 905 Juniper Ave
- 900 Jasmine Cir
- 920 Jasmine Cir
- 833 Juniper Ave
- 914 Juniper Ave
- 1015 Juniper Ave
- 918 Juniper Ave
- 912 Juniper Ave
- 855 Juniper Ave
- 3555 9th St
- 1025 Juniper Ave
- 916 Juniper Ave
- 1028 Juniper Ave
- 835 Juniper Ave
- 3560 9th St
- 900 Juniper Ave
- 3575 9th St
- 870 Juniper Ave
- 1000 Jasmine Cir