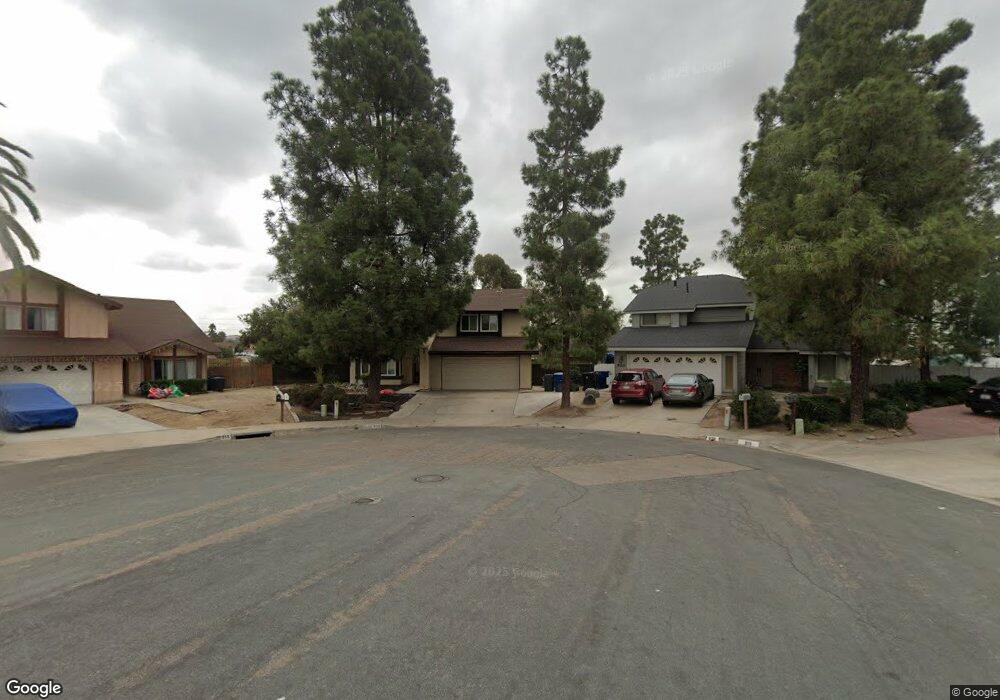
919 Mesa Ct Chula Vista, CA 91910
Rancho Del Rey NeighborhoodEstimated Value: $883,740 - $1,056,000
4
Beds
3
Baths
2,143
Sq Ft
$466/Sq Ft
Est. Value
About This Home
This home is located at 919 Mesa Ct, Chula Vista, CA 91910 and is currently estimated at $998,685, approximately $466 per square foot. 919 Mesa Ct is a home located in San Diego County with nearby schools including Halecrest Elementary School, Hilltop Middle School, and Hilltop Senior High School.
Ownership History
Date
Name
Owned For
Owner Type
Purchase Details
Closed on
Sep 17, 2012
Sold by
Roark Erik
Bought by
Roark Eric
Current Estimated Value
Home Financials for this Owner
Home Financials are based on the most recent Mortgage that was taken out on this home.
Original Mortgage
$130,000
Interest Rate
3.59%
Mortgage Type
New Conventional
Purchase Details
Closed on
Feb 8, 2011
Sold by
Roark Eric
Bought by
Roark Eric
Purchase Details
Closed on
Mar 26, 2010
Sold by
Roark Ernie A and Roark Merrilu Conner
Bought by
Roark Eric
Home Financials for this Owner
Home Financials are based on the most recent Mortgage that was taken out on this home.
Original Mortgage
$105,000
Interest Rate
4.29%
Mortgage Type
New Conventional
Purchase Details
Closed on
Aug 13, 1996
Sold by
Conner Inter Vivos Trust A 08-15-84 and Ernie A
Bought by
Roark Ernie A
Create a Home Valuation Report for This Property
The Home Valuation Report is an in-depth analysis detailing your home's value as well as a comparison with similar homes in the area
Home Values in the Area
Average Home Value in this Area
Purchase History
| Date | Buyer | Sale Price | Title Company |
|---|---|---|---|
| Roark Eric | -- | Accommodation | |
| Roark Eric | -- | American Coast Title | |
| Roark Eric | -- | None Available | |
| Roark Eric | -- | Ticor Title | |
| Roark Ernie A | -- | -- |
Source: Public Records
Mortgage History
| Date | Status | Borrower | Loan Amount |
|---|---|---|---|
| Closed | Roark Eric | $130,000 | |
| Closed | Roark Eric | $105,000 |
Source: Public Records
Tax History Compared to Growth
Tax History
| Year | Tax Paid | Tax Assessment Tax Assessment Total Assessment is a certain percentage of the fair market value that is determined by local assessors to be the total taxable value of land and additions on the property. | Land | Improvement |
|---|---|---|---|---|
| 2025 | $3,700 | $298,992 | $124,576 | $174,416 |
| 2024 | $3,700 | $293,131 | $122,134 | $170,997 |
| 2023 | $3,645 | $287,385 | $119,740 | $167,645 |
| 2022 | $3,538 | $281,751 | $117,393 | $164,358 |
| 2021 | $3,460 | $276,228 | $115,092 | $161,136 |
| 2020 | $3,380 | $273,396 | $113,912 | $159,484 |
| 2019 | $3,294 | $268,036 | $111,679 | $156,357 |
| 2018 | $3,240 | $262,782 | $109,490 | $153,292 |
| 2017 | $11 | $257,631 | $107,344 | $150,287 |
| 2016 | $3,097 | $252,581 | $105,240 | $147,341 |
| 2015 | $3,054 | $248,788 | $103,660 | $145,128 |
| 2014 | $3,003 | $243,916 | $101,630 | $142,286 |
Source: Public Records
Map
Nearby Homes
- 1002 Cholla Place
- 1008 Calma Dr
- 640 E J St
- 820 Chervil Ct
- 1029 Vista Oak Place
- 626 Mariposa Cir
- 838 David Dr
- 589 E J St
- 566 Telegraph Canyon Rd Unit A
- 554 Telegraph Canyon Rd Unit F
- 548 Telegraph Canyon Rd Unit D
- 826 Floyd Ave
- 486 E Naples St
- 491 Nanette St
- 484 Hale St
- 843 Calle Ciela Vista Unit 20
- 578 Nantucket Dr
- 713 Esla Dr
- 1169 Oasis Ave
- 1158 Oasis Ave