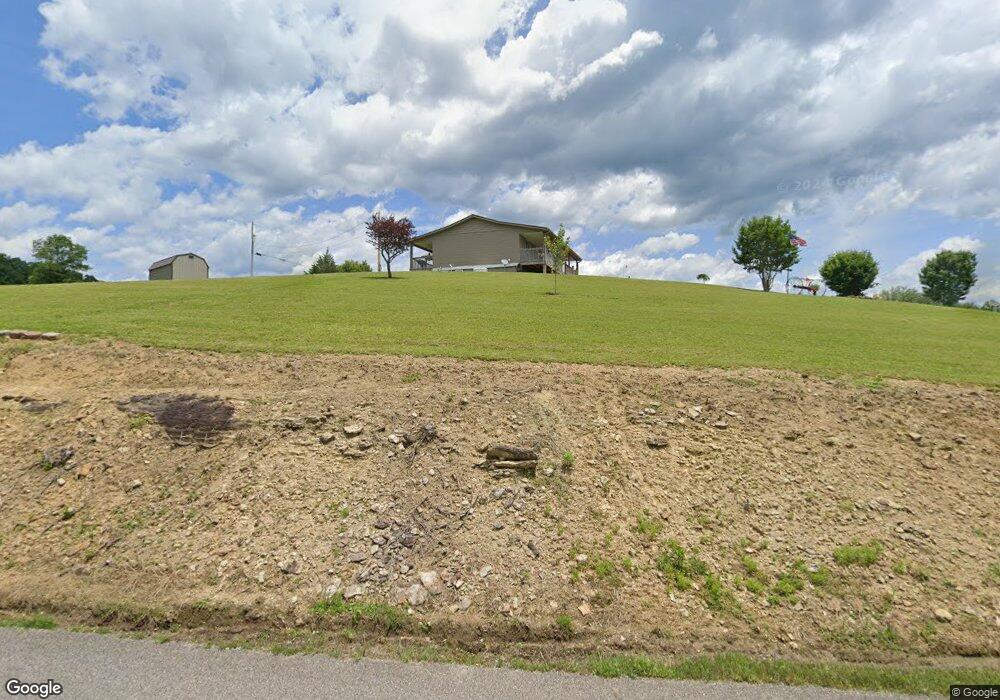
919 Shady Grove Rd Lancing, TN 37770
Estimated Value: $180,000 - $380,000
--
Bed
2
Baths
1,344
Sq Ft
$208/Sq Ft
Est. Value
About This Home
This home is located at 919 Shady Grove Rd, Lancing, TN 37770 and is currently estimated at $280,000, approximately $208 per square foot. 919 Shady Grove Rd is a home located in Morgan County with nearby schools including Central Elementary School, Petros Joyner Elementary School, and Central Middle School.
Ownership History
Date
Name
Owned For
Owner Type
Purchase Details
Closed on
Jun 7, 2021
Sold by
Wilson Jerry and Wilson Alice
Bought by
Wilson Travis Lee
Current Estimated Value
Purchase Details
Closed on
May 15, 2020
Sold by
Campbell Charles O and Campbell Jane W
Bought by
Wilson Jerry and Wilson Alice
Purchase Details
Closed on
Aug 29, 2013
Sold by
Campbell Charles O
Bought by
Campbell Charles O
Purchase Details
Closed on
May 10, 2012
Sold by
Campbell Charles O
Bought by
Campbell Charles O and Campbell Jane W
Purchase Details
Closed on
Oct 12, 2010
Sold by
Campbell Charles O
Bought by
Dill David L
Purchase Details
Closed on
Feb 11, 2005
Sold by
Not Provided
Bought by
Campbell Charles O
Purchase Details
Closed on
Sep 30, 1998
Bought by
Campbell Mary A
Purchase Details
Closed on
Jul 7, 1995
Bought by
Campbell David and Campbell Mary
Purchase Details
Closed on
Mar 15, 1991
Bought by
Doughman Frank W and Doughman Beverly M
Purchase Details
Closed on
Dec 5, 1984
Bought by
Murphy Gail T
Purchase Details
Closed on
Jun 7, 1984
Purchase Details
Closed on
Sep 11, 1943
Create a Home Valuation Report for This Property
The Home Valuation Report is an in-depth analysis detailing your home's value as well as a comparison with similar homes in the area
Home Values in the Area
Average Home Value in this Area
Purchase History
| Date | Buyer | Sale Price | Title Company |
|---|---|---|---|
| Wilson Travis Lee | $80,000 | None Available | |
| Wilson Jerry | $80,000 | None Available | |
| Campbell Charles O | -- | -- | |
| Campbell Jane W | -- | -- | |
| Campbell Charles O | -- | -- | |
| Dill David L | $25,000 | -- | |
| Campbell Charles O | -- | -- | |
| Campbell Mary A | -- | -- | |
| Campbell David | $48,000 | -- | |
| Doughman Frank W | $33,900 | -- | |
| Murphy Gail T | -- | -- | |
| Murphy Gail T | -- | -- | |
| -- | -- | -- | |
| -- | -- | -- |
Source: Public Records
Tax History Compared to Growth
Tax History
| Year | Tax Paid | Tax Assessment Tax Assessment Total Assessment is a certain percentage of the fair market value that is determined by local assessors to be the total taxable value of land and additions on the property. | Land | Improvement |
|---|---|---|---|---|
| 2024 | $1,360 | $50,000 | $6,375 | $43,625 |
| 2023 | $1,360 | $50,000 | $6,375 | $43,625 |
| 2022 | $1,420 | $52,225 | $6,375 | $45,850 |
| 2021 | $170 | $51,025 | $5,175 | $45,850 |
| 2020 | $352 | $6,250 | $5,175 | $1,075 |
| 2019 | $352 | $10,775 | $9,075 | $1,700 |
| 2018 | $352 | $10,775 | $9,075 | $1,700 |
| 2017 | $382 | $12,100 | $9,075 | $3,025 |
| 2016 | $382 | $12,100 | $9,075 | $3,025 |
| 2015 | $375 | $12,100 | $9,075 | $3,025 |
| 2014 | $429 | $13,825 | $9,700 | $4,125 |
| 2013 | $428 | $13,808 | $0 | $0 |
Source: Public Records
Map
Nearby Homes
- 0 Catoosa Drive- Lot 27 Unit 1313024
- 0 Catoosa Dr Unit 9984813
- 0 Catoosa Dr Unit RTC2968417
- 0 Catoosa Dr Unit RTC2968409
- 451 Shady Grove Rd
- 133 Lily Rd
- 258 Charlie Newberry Rd
- Lot 16 Catoosa Rd
- 0 Freels Ln
- 179 Human Dr
- 365 Hidden Hills Rd
- 131 Ridge Rd
- 130 Ridge Rd
- 391 Ridge Rd
- 149 Fox Trail
- 1854 Catoosa Rd
- 1855 Catoosa Rd
- 0 Catoosa Rd
- 19 Catoosa Rd
- 180 Grady Langley Rd
- 951 Shady Grove Rd
- 920 Shady Grove Rd
- 105 Arthur McCormick Rd
- 882 Shady Grove Rd
- 868 Shady Grove Rd
- 845 Shady Grove Rd
- 1220 Shady Grove Rd
- 985 Shady Grove Rd
- 0 Off Shady Grove Rd Unit 138602
- 0 Off Shady Grove Rd Unit 138601
- Lot 2 Shady Grove Rd
- Lot 14 Shady Grove Rd
- Lot A Shady Grove Rd
- Lot 23 Shady Grove Rd
- Lot 30 Shady Grove Rd
- Lot 34 Shady Grove Rd
- Lot 10 Shady Grove Rd
- Lot 17 Shady Grove Rd
- Lot 36 Shady Grove Rd
- 0 Off Shady Grove Rd Unit 616585