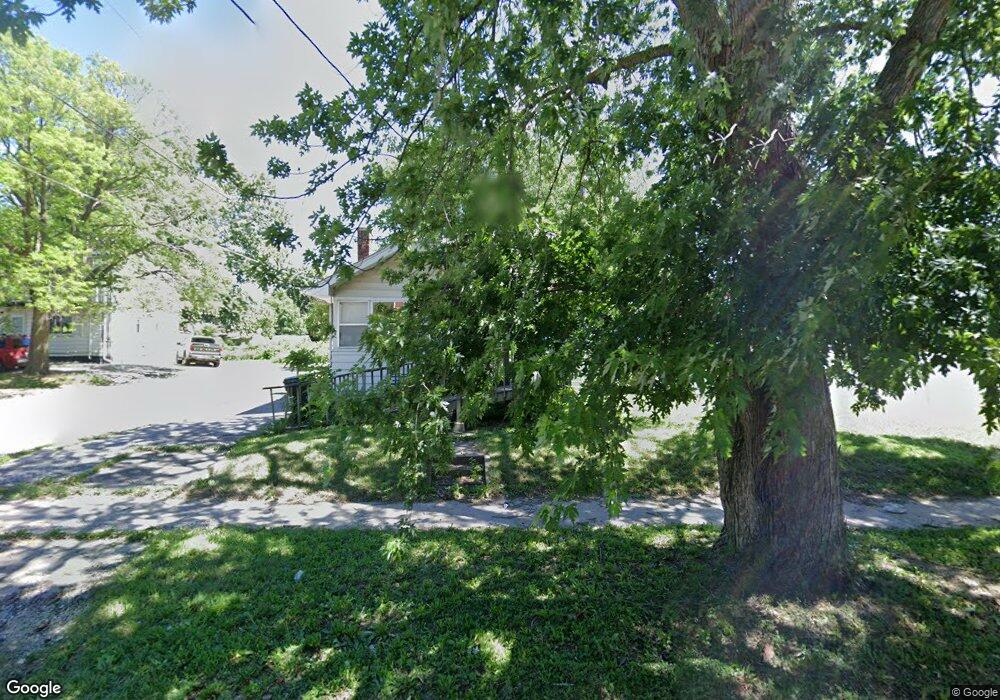
919 W 9th St Waterloo, IA 50702
Neighbors Helping Neighbors NeighborhoodEstimated Value: $88,000 - $95,000
2
Beds
1
Bath
832
Sq Ft
$110/Sq Ft
Est. Value
About This Home
This home is located at 919 W 9th St, Waterloo, IA 50702 and is currently estimated at $91,570, approximately $110 per square foot. 919 W 9th St is a home located in Black Hawk County with nearby schools including Lowell Elementary School, Bunger Middle School, and West High School.
Ownership History
Date
Name
Owned For
Owner Type
Purchase Details
Closed on
Mar 5, 2016
Sold by
Kisner Sahron K
Bought by
Hadzic Kellie Sue
Current Estimated Value
Create a Home Valuation Report for This Property
The Home Valuation Report is an in-depth analysis detailing your home's value as well as a comparison with similar homes in the area
Home Values in the Area
Average Home Value in this Area
Purchase History
| Date | Buyer | Sale Price | Title Company |
|---|---|---|---|
| Hadzic Kellie Sue | -- | None Available |
Source: Public Records
Tax History Compared to Growth
Tax History
| Year | Tax Paid | Tax Assessment Tax Assessment Total Assessment is a certain percentage of the fair market value that is determined by local assessors to be the total taxable value of land and additions on the property. | Land | Improvement |
|---|---|---|---|---|
| 2025 | $1,348 | $73,840 | $9,310 | $64,530 |
| 2024 | $1,348 | $72,370 | $9,310 | $63,060 |
| 2023 | $1,696 | $72,370 | $9,310 | $63,060 |
| 2022 | $1,786 | $53,420 | $9,310 | $44,110 |
| 2021 | $1,220 | $53,420 | $9,310 | $44,110 |
| 2020 | $1,049 | $51,480 | $9,310 | $42,170 |
| 2019 | $1,120 | $51,480 | $9,310 | $42,170 |
| 2018 | $1,120 | $51,480 | $9,310 | $42,170 |
| 2017 | $954 | $51,480 | $9,310 | $42,170 |
| 2016 | $970 | $51,480 | $9,310 | $42,170 |
| 2015 | $970 | $51,480 | $9,310 | $42,170 |
| 2014 | $914 | $48,230 | $9,310 | $38,920 |
Source: Public Records
Map
Nearby Homes
- 923 W 9th St
- 1113 Leavitt St
- 927 W 9th St
- 1108 Grant Ave Unit 8
- 1108 Grant Ave Unit 7
- 1108 Grant Ave Unit 6
- 1108 Grant Ave Unit 5
- 1108 Grant Ave Unit 4
- 1108 Grant Ave Unit 3
- 1108 Grant Ave Unit 2
- 1108 Grant Ave Unit 1
- 1108 Grant Ave
- 1117 Leavitt St
- 1112 Grant Ave
- 1100 Grant Ave
- 918 W 9th St
- 1116 Grant Ave
- 922 W 9th St
- 912 W 9th St
- 1123 Leavitt St