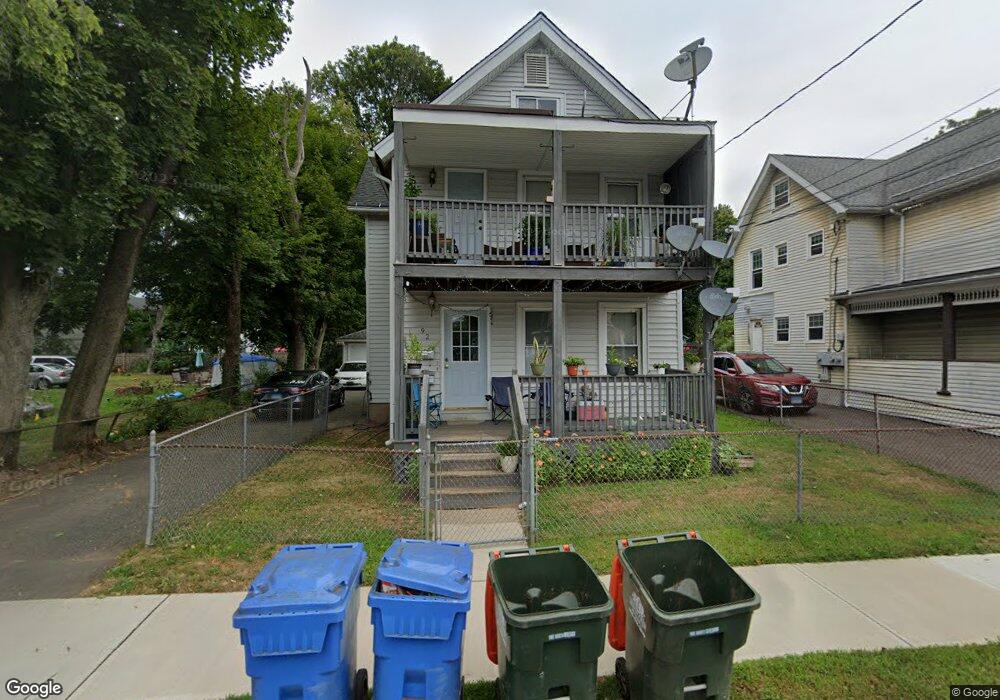
92 Sherman Ave Meriden, CT 06450
Estimated Value: $288,000 - $322,000
4
Beds
2
Baths
1,520
Sq Ft
$205/Sq Ft
Est. Value
About This Home
This home is located at 92 Sherman Ave, Meriden, CT 06450 and is currently estimated at $311,891, approximately $205 per square foot. 92 Sherman Ave is a home located in New Haven County with nearby schools including Nathan Hale Elementary School, Francis T. Maloney High School, and Chase Collegiate School.
Ownership History
Date
Name
Owned For
Owner Type
Purchase Details
Closed on
Oct 17, 2007
Sold by
Deutsche Bk T Co Ameri
Bought by
Espinosa Maria and Espinosa Tabare
Current Estimated Value
Purchase Details
Closed on
Mar 9, 2006
Sold by
Dontfraid Domian
Bought by
Mitchell Clarence
Home Financials for this Owner
Home Financials are based on the most recent Mortgage that was taken out on this home.
Original Mortgage
$169,915
Interest Rate
10.9%
Purchase Details
Closed on
Feb 18, 2000
Sold by
Flood Brian M
Bought by
Dontfraid Debbie and Dontfraid Damian
Home Financials for this Owner
Home Financials are based on the most recent Mortgage that was taken out on this home.
Original Mortgage
$59,200
Interest Rate
8.11%
Purchase Details
Closed on
Aug 1, 1996
Sold by
Rose Matty Attlas and Cocchiaro Kathy
Bought by
Flood Brian M
Home Financials for this Owner
Home Financials are based on the most recent Mortgage that was taken out on this home.
Original Mortgage
$38,400
Interest Rate
8.24%
Create a Home Valuation Report for This Property
The Home Valuation Report is an in-depth analysis detailing your home's value as well as a comparison with similar homes in the area
Home Values in the Area
Average Home Value in this Area
Purchase History
| Date | Buyer | Sale Price | Title Company |
|---|---|---|---|
| Espinosa Maria | $84,900 | -- | |
| Mitchell Clarence | $199,900 | -- | |
| Dontfraid Debbie | $74,000 | -- | |
| Flood Brian M | $30,000 | -- |
Source: Public Records
Mortgage History
| Date | Status | Borrower | Loan Amount |
|---|---|---|---|
| Previous Owner | Flood Brian M | $169,915 | |
| Previous Owner | Flood Brian M | $29,985 | |
| Previous Owner | Flood Brian M | $59,200 | |
| Previous Owner | Flood Brian M | $38,400 |
Source: Public Records
Tax History Compared to Growth
Tax History
| Year | Tax Paid | Tax Assessment Tax Assessment Total Assessment is a certain percentage of the fair market value that is determined by local assessors to be the total taxable value of land and additions on the property. | Land | Improvement |
|---|---|---|---|---|
| 2025 | $4,294 | $113,260 | $30,030 | $83,230 |
| 2024 | $4,362 | $113,260 | $30,030 | $83,230 |
| 2023 | $4,204 | $113,260 | $30,030 | $83,230 |
| 2022 | $3,966 | $113,260 | $30,030 | $83,230 |
| 2021 | $3,778 | $86,800 | $31,080 | $55,720 |
| 2020 | $3,768 | $86,800 | $31,080 | $55,720 |
| 2019 | $3,736 | $86,800 | $31,080 | $55,720 |
| 2018 | $3,751 | $86,800 | $31,080 | $55,720 |
| 2017 | $3,651 | $86,800 | $31,080 | $55,720 |
| 2016 | $3,403 | $87,920 | $21,770 | $66,150 |
| 2015 | $3,403 | $87,780 | $21,630 | $66,150 |
| 2014 | $3,321 | $87,780 | $21,630 | $66,150 |
Source: Public Records
Map
Nearby Homes
- 52 Webster St
- 33 Prescott St
- 22 Webster St
- 23 Howe St
- 387 Colony St
- 30 Tremont St
- 51 Griswold St
- 465 Pratt Street Extension
- 145 Camp St
- 181 Hicks St Unit 2C
- 53 Woodland St
- 246 Pratt St
- 618 Blackstone Village
- 149 Woodland St
- 760 Broad St
- 201 Colony St
- 250 Pratt St
- 19 Blackstone St
- 129 Orchard St
- 131 Converse Ave
- 94 Sherman Ave
- 80 Sherman Ave
- 100 Sherman Ave
- 93 Sherman Ave
- 106 Sherman Ave
- 85 Sherman Ave
- 79 Sherman Ave
- 91 Britannia St
- 97 Sherman Ave
- 83 Prescott St
- 115 Britannia St
- 110 Sherman Ave
- 130 Warren St
- 77 Sherman Ave
- 103 Sherman Ave
- 134 Warren St
- 66 Sherman Ave
- 109 Sherman Ave
- 67 Sherman Ave
- 80 Prescott St