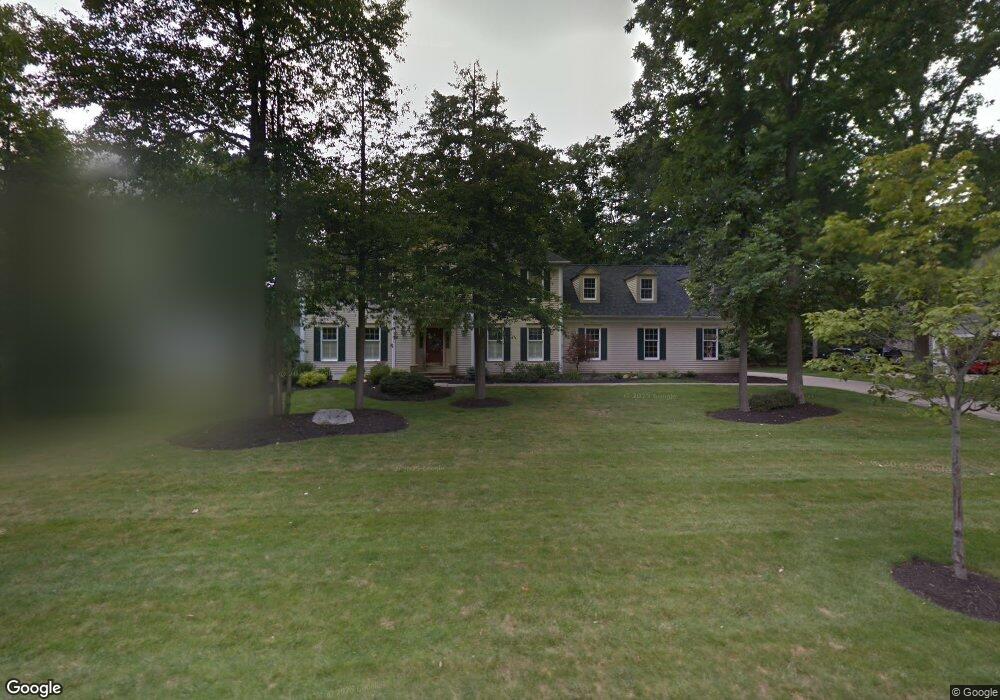
92 Steepleview Dr Hudson, OH 44236
Estimated Value: $650,287 - $780,000
4
Beds
4
Baths
3,276
Sq Ft
$214/Sq Ft
Est. Value
About This Home
This home is located at 92 Steepleview Dr, Hudson, OH 44236 and is currently estimated at $699,572, approximately $213 per square foot. 92 Steepleview Dr is a home located in Summit County with nearby schools including Ellsworth Hill Elementary School, East Woods Intermediate School, and Hudson Middle School.
Ownership History
Date
Name
Owned For
Owner Type
Purchase Details
Closed on
Apr 17, 2019
Sold by
Earle Robin L and Earle Lynn A
Bought by
Mcmasters Michael and Mcmasters Ashley
Current Estimated Value
Purchase Details
Closed on
Oct 27, 1997
Sold by
Wozniak Gregory
Bought by
Earle Lynn A and Earle Robin L
Home Financials for this Owner
Home Financials are based on the most recent Mortgage that was taken out on this home.
Original Mortgage
$264,000
Outstanding Balance
$44,671
Interest Rate
7.63%
Mortgage Type
New Conventional
Estimated Equity
$654,901
Purchase Details
Closed on
Jan 3, 1997
Sold by
Dombi Michael J
Bought by
Wozniak Gregory and Wozniak Deborah S
Home Financials for this Owner
Home Financials are based on the most recent Mortgage that was taken out on this home.
Original Mortgage
$160,000
Interest Rate
7.6%
Mortgage Type
New Conventional
Create a Home Valuation Report for This Property
The Home Valuation Report is an in-depth analysis detailing your home's value as well as a comparison with similar homes in the area
Home Values in the Area
Average Home Value in this Area
Purchase History
| Date | Buyer | Sale Price | Title Company |
|---|---|---|---|
| Mcmasters Michael | $495,000 | Allegiance Title | |
| Earle Lynn A | $330,000 | -- | |
| Wozniak Gregory | $325,000 | -- |
Source: Public Records
Mortgage History
| Date | Status | Borrower | Loan Amount |
|---|---|---|---|
| Open | Earle Lynn A | $264,000 | |
| Previous Owner | Wozniak Gregory | $160,000 |
Source: Public Records
Tax History
| Year | Tax Paid | Tax Assessment Tax Assessment Total Assessment is a certain percentage of the fair market value that is determined by local assessors to be the total taxable value of land and additions on the property. | Land | Improvement |
|---|---|---|---|---|
| 2024 | $9,424 | $185,245 | $36,904 | $148,341 |
| 2023 | $9,424 | $185,245 | $36,904 | $148,341 |
| 2022 | $8,455 | $148,275 | $29,523 | $118,752 |
| 2021 | $8,470 | $148,275 | $29,523 | $118,752 |
| 2020 | $8,320 | $148,270 | $29,520 | $118,750 |
| 2019 | $9,612 | $158,790 | $29,520 | $129,270 |
| 2018 | $9,578 | $158,790 | $29,520 | $129,270 |
| 2017 | $8,190 | $158,790 | $29,520 | $129,270 |
| 2016 | $8,325 | $133,060 | $29,520 | $103,540 |
| 2015 | $8,190 | $133,060 | $29,520 | $103,540 |
| 2014 | $8,213 | $133,060 | $29,520 | $103,540 |
| 2013 | $8,194 | $129,670 | $29,520 | $100,150 |
Source: Public Records
Map
Nearby Homes
- 100 Blackberry Dr
- 24 Morning Song Ln
- 503 Cutler Ln
- 1440 E Hines Hill Rd
- 569 Atterbury Blvd
- 8 Hudson Common Dr Unit 8
- 381 Boston Mills Rd
- 1998 E Hines Hill Rd
- 34 Chadbourne Dr
- 61 Lake Forest Dr
- 43 N Oviatt St
- 12 N Oviatt St
- 179 Elm St
- 7350 Herrick Park Dr
- 213 E Streetsboro St
- 42 Fox Trace Ln
- 6101 Independence Dr
- 2396 Leeway Dr
- 171 Ravenna St
- 2297 Olde Farm Ln
- 84 Steepleview Dr
- 98 Steepleview Dr
- 45 Great Oak Dr
- 101 Ambrose Dr
- 91 Steepleview Dr
- 51 Great Oak Dr
- 83 Steepleview Dr
- 97 Steepleview Dr
- 95 Ambrose Dr
- 31 Great Oak Dr
- 53 Great Oak Dr
- 36 Great Oak Dr
- 44 Great Oak Dr
- 87 Ambrose Dr
- 114 Ambrose Dr
- 100 Ambrose Dr
- 50 Great Oak Dr
- 59 Great Oak Dr
- 71 Steepleview Dr
Your Personal Tour Guide
Ask me questions while you tour the home.