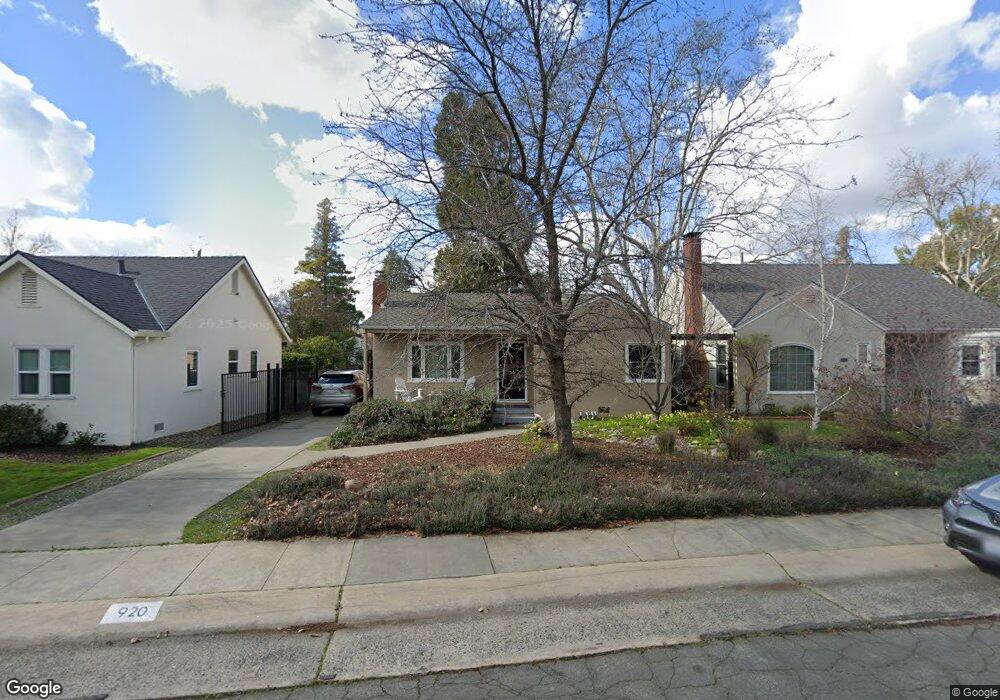
920 54th St Sacramento, CA 95819
East Sacramento NeighborhoodEstimated Value: $569,933 - $603,000
2
Beds
1
Bath
829
Sq Ft
$713/Sq Ft
Est. Value
About This Home
This home is located at 920 54th St, Sacramento, CA 95819 and is currently estimated at $590,733, approximately $712 per square foot. 920 54th St is a home located in Sacramento County with nearby schools including Caleb Greenwood Elementary, Miwok Middle School, and Hiram W. Johnson High School.
Ownership History
Date
Name
Owned For
Owner Type
Purchase Details
Closed on
Mar 5, 2003
Sold by
Fifer Amy M
Bought by
Kvenvolden Keith A and Kvenvolden Mary Ann
Current Estimated Value
Purchase Details
Closed on
Jul 16, 2001
Sold by
Fifer Amy M and Saverien Amy F
Bought by
Fifer Amy M
Purchase Details
Closed on
Aug 20, 1999
Sold by
Fischbach Mark C and Green Tristin K
Bought by
Saverien Amy F
Home Financials for this Owner
Home Financials are based on the most recent Mortgage that was taken out on this home.
Original Mortgage
$160,675
Interest Rate
7.63%
Mortgage Type
FHA
Purchase Details
Closed on
Aug 5, 1998
Sold by
Clary Allen F and Clary Dorothy A
Bought by
Fischbach Mark C and Green Tristin K
Home Financials for this Owner
Home Financials are based on the most recent Mortgage that was taken out on this home.
Original Mortgage
$84,000
Interest Rate
5.75%
Create a Home Valuation Report for This Property
The Home Valuation Report is an in-depth analysis detailing your home's value as well as a comparison with similar homes in the area
Home Values in the Area
Average Home Value in this Area
Purchase History
| Date | Buyer | Sale Price | Title Company |
|---|---|---|---|
| Kvenvolden Keith A | $255,000 | Stewart Title Of Sacramento | |
| Fifer Amy M | -- | -- | |
| Saverien Amy F | $162,000 | Old Republic Title Company | |
| Fischbach Mark C | $105,000 | Chicago Title Co |
Source: Public Records
Mortgage History
| Date | Status | Borrower | Loan Amount |
|---|---|---|---|
| Previous Owner | Saverien Amy F | $160,675 | |
| Previous Owner | Fischbach Mark C | $84,000 |
Source: Public Records
Tax History Compared to Growth
Tax History
| Year | Tax Paid | Tax Assessment Tax Assessment Total Assessment is a certain percentage of the fair market value that is determined by local assessors to be the total taxable value of land and additions on the property. | Land | Improvement |
|---|---|---|---|---|
| 2025 | $4,380 | $369,302 | $217,239 | $152,063 |
| 2024 | $4,380 | $362,062 | $212,980 | $149,082 |
| 2023 | $4,277 | $354,963 | $208,804 | $146,159 |
| 2022 | $4,205 | $348,004 | $204,710 | $143,294 |
| 2021 | $4,006 | $341,182 | $200,697 | $140,485 |
| 2020 | $4,039 | $337,685 | $198,640 | $139,045 |
| 2019 | $3,954 | $331,065 | $194,746 | $136,319 |
| 2018 | $3,851 | $324,575 | $190,928 | $133,647 |
| 2017 | $3,797 | $318,212 | $187,185 | $131,027 |
| 2016 | $3,733 | $311,973 | $183,515 | $128,458 |
| 2015 | $3,678 | $307,288 | $180,759 | $126,529 |
| 2014 | $3,579 | $301,270 | $177,219 | $124,051 |
Source: Public Records
Map
Nearby Homes