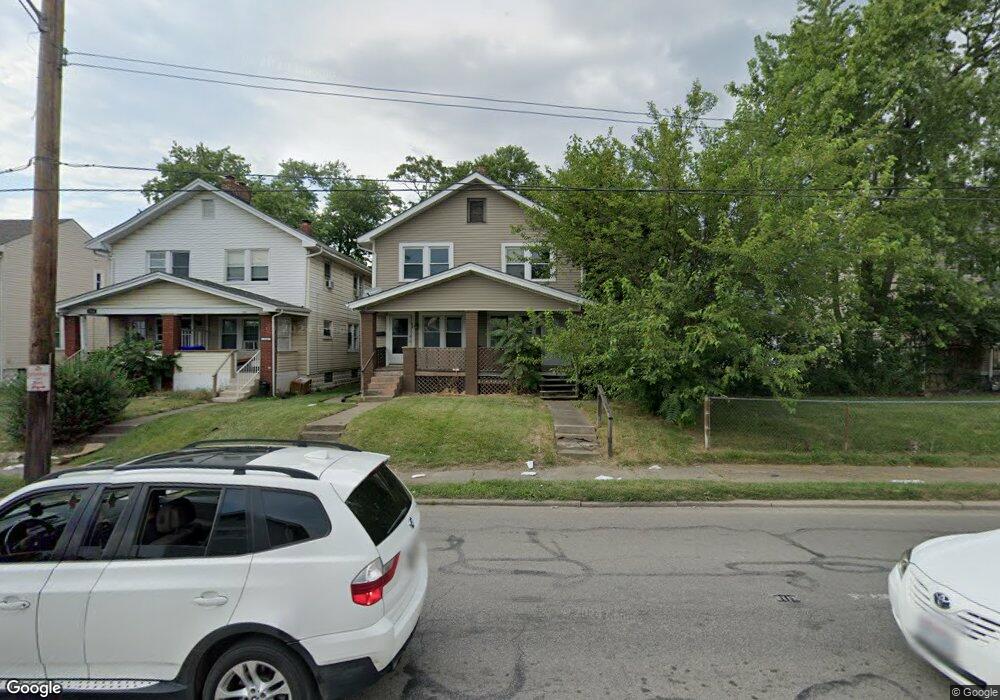
920-922 E 17th Ave Columbus, OH 43211
South Linden NeighborhoodEstimated Value: $154,000 - $221,000
6
Beds
2
Baths
2,352
Sq Ft
$83/Sq Ft
Est. Value
About This Home
This home is located at 920-922 E 17th Ave, Columbus, OH 43211 and is currently estimated at $194,667, approximately $82 per square foot. 920-922 E 17th Ave is a home located in Franklin County with nearby schools including Windsor Stem Acadmey, Linden-Mckinley Stem School On Arcadia, and North Columbus Preparatory Academy.
Ownership History
Date
Name
Owned For
Owner Type
Purchase Details
Closed on
May 5, 2017
Sold by
Swan Richard E and Swan Monica
Bought by
Camelab Llc
Current Estimated Value
Purchase Details
Closed on
Mar 17, 2014
Sold by
Mcgouch Ronald T and Ponyah Cindy
Bought by
Swan Richard E
Purchase Details
Closed on
Oct 19, 2006
Sold by
Hollobaugh Inc
Bought by
Mcgough Ronald T and Ponyah Cindy
Home Financials for this Owner
Home Financials are based on the most recent Mortgage that was taken out on this home.
Original Mortgage
$63,900
Interest Rate
8%
Mortgage Type
Purchase Money Mortgage
Purchase Details
Closed on
Aug 21, 1998
Sold by
Hollobaugh Randy J and Hollobaugh Cindy A
Bought by
Hollobaugh Inc
Home Financials for this Owner
Home Financials are based on the most recent Mortgage that was taken out on this home.
Original Mortgage
$40,000
Interest Rate
7.5%
Purchase Details
Closed on
Jan 5, 1993
Purchase Details
Closed on
Dec 28, 1989
Create a Home Valuation Report for This Property
The Home Valuation Report is an in-depth analysis detailing your home's value as well as a comparison with similar homes in the area
Home Values in the Area
Average Home Value in this Area
Purchase History
| Date | Buyer | Sale Price | Title Company |
|---|---|---|---|
| Camelab Llc | $30,000 | Pm Title Llc | |
| Swan Richard E | $19,000 | Stewart Title | |
| Mcgough Ronald T | $63,900 | Cornerstone Title Agency Inc | |
| Hollobaugh Inc | -- | -- | |
| -- | $24,000 | -- | |
| -- | -- | -- |
Source: Public Records
Mortgage History
| Date | Status | Borrower | Loan Amount |
|---|---|---|---|
| Previous Owner | Mcgough Ronald T | $63,900 | |
| Previous Owner | Hollobaugh Inc | $40,000 |
Source: Public Records
Tax History
| Year | Tax Paid | Tax Assessment Tax Assessment Total Assessment is a certain percentage of the fair market value that is determined by local assessors to be the total taxable value of land and additions on the property. | Land | Improvement |
|---|---|---|---|---|
| 2025 | $2,976 | $64,930 | $5,390 | $59,540 |
| 2024 | $2,976 | $64,930 | $5,390 | $59,540 |
| 2023 | $2,938 | $64,925 | $5,390 | $59,535 |
| 2022 | $1,751 | $21,950 | $2,590 | $19,360 |
| 2021 | $1,169 | $21,950 | $2,590 | $19,360 |
| 2020 | $1,170 | $21,950 | $2,590 | $19,360 |
| 2019 | $1,139 | $18,310 | $2,170 | $16,140 |
| 2018 | $975 | $18,310 | $2,170 | $16,140 |
| 2017 | $958 | $18,310 | $2,170 | $16,140 |
| 2016 | $1,428 | $11,450 | $2,450 | $9,000 |
| 2015 | $708 | $11,450 | $2,450 | $9,000 |
| 2014 | $710 | $11,450 | $2,450 | $9,000 |
| 2013 | $389 | $12,705 | $2,730 | $9,975 |
Source: Public Records
Map
Nearby Homes
- 914-916 E 17th Ave
- 957 E 17th Ave
- 0 E 18th Ave
- 1705 Lexington Ave
- 1045-1051 E 20th Ave
- 990 E 21st Ave
- 1047 E 21st Ave
- 915 E 13th Ave
- 1027 E 14th Ave
- 1033 E 22nd Ave
- 1129 E 17th Ave
- 1538-1542 Accommodation Ave
- 1136 E 21st Ave
- 1673 Cleveland Ave
- 957 E 12th Ave
- 1201 E 20th Ave
- 1109 Windsor Ave Unit 1103
- 1129 E 23rd Ave Unit 1129 - 1131
- 1111 Windsor Ave
- 1121 Windsor Ave
- 920 E 17th Ave Unit 922
- 922 E 17th Ave
- 914 E Ns 17th Ave Unit 914-916
- 914 E 17th Ave Unit 916
- 0 E Seventeenth Ave
- 912 E 17th Ave
- 930 E 17th Ave
- 906 E 17th Ave Unit 908
- 927 E 18th Ave
- 940 E 17th Ave
- 931-933 E 18th Ave
- 931 E 18th Ave Unit 933
- 923 E 18th Ave
- 919 E 18th Ave
- 898 E 17th Ave
- 919 E 17th Ave
- 915 E 17th Ave
- 923 E 17th Ave
- 915 E 18th Ave
- 941 E 18th Ave
Your Personal Tour Guide
Ask me questions while you tour the home.