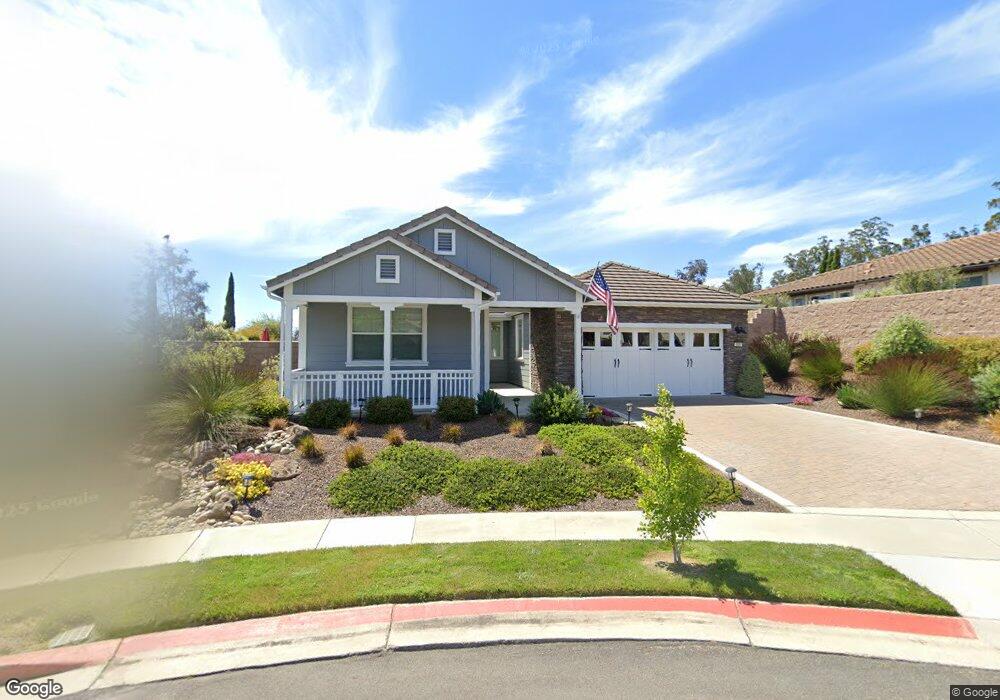
920 Bea Ct Nipomo, CA 93444
Woodlands NeighborhoodEstimated Value: $1,108,000 - $1,209,000
2
Beds
2
Baths
2,025
Sq Ft
$578/Sq Ft
Est. Value
About This Home
This home is located at 920 Bea Ct, Nipomo, CA 93444 and is currently estimated at $1,170,891, approximately $578 per square foot. 920 Bea Ct is a home located in San Luis Obispo County with nearby schools including Dorothea Lange Elementary School, Mesa Middle School, and Nipomo High School.
Ownership History
Date
Name
Owned For
Owner Type
Purchase Details
Closed on
Jan 17, 2013
Sold by
Morse Christopher B and Morse Michelle J
Bought by
Morse Christopher B and Morse Michelle J
Current Estimated Value
Home Financials for this Owner
Home Financials are based on the most recent Mortgage that was taken out on this home.
Original Mortgage
$407,000
Outstanding Balance
$77,501
Interest Rate
3.36%
Mortgage Type
New Conventional
Estimated Equity
$1,093,390
Purchase Details
Closed on
Dec 3, 2010
Sold by
Morse Christopher B and Morse Michelle J
Bought by
Morse Christopher B and Morse Michelle J
Purchase Details
Closed on
Sep 28, 2010
Sold by
Keller Samuel and Keller Deborah L
Bought by
Morse Christopher B and Morse Michelle J
Home Financials for this Owner
Home Financials are based on the most recent Mortgage that was taken out on this home.
Original Mortgage
$417,000
Interest Rate
4.33%
Mortgage Type
New Conventional
Purchase Details
Closed on
Apr 17, 2008
Sold by
Shea Homes Lp
Bought by
Keller Samuel and Keller Deborah L
Home Financials for this Owner
Home Financials are based on the most recent Mortgage that was taken out on this home.
Original Mortgage
$300,000
Interest Rate
5.81%
Mortgage Type
Purchase Money Mortgage
Create a Home Valuation Report for This Property
The Home Valuation Report is an in-depth analysis detailing your home's value as well as a comparison with similar homes in the area
Home Values in the Area
Average Home Value in this Area
Purchase History
| Date | Buyer | Sale Price | Title Company |
|---|---|---|---|
| Morse Christopher B | -- | First American Title Company | |
| Morse Christopher B | -- | First American Title Company | |
| Morse Christopher B | -- | None Available | |
| Morse Christopher B | $527,500 | Fidelity National Title Co | |
| Keller Samuel | $550,000 | First American Title Co |
Source: Public Records
Mortgage History
| Date | Status | Borrower | Loan Amount |
|---|---|---|---|
| Open | Morse Christopher B | $407,000 | |
| Closed | Morse Christopher B | $417,000 | |
| Previous Owner | Keller Samuel | $300,000 |
Source: Public Records
Tax History
| Year | Tax Paid | Tax Assessment Tax Assessment Total Assessment is a certain percentage of the fair market value that is determined by local assessors to be the total taxable value of land and additions on the property. | Land | Improvement |
|---|---|---|---|---|
| 2025 | $6,951 | $675,810 | $320,289 | $355,521 |
| 2024 | $6,872 | $662,559 | $314,009 | $348,550 |
| 2023 | $6,872 | $649,568 | $307,852 | $341,716 |
| 2022 | $6,768 | $636,832 | $301,816 | $335,016 |
| 2021 | $6,756 | $624,347 | $295,899 | $328,448 |
| 2020 | $6,678 | $617,946 | $292,865 | $325,081 |
| 2019 | $6,637 | $605,830 | $287,123 | $318,707 |
| 2018 | $6,558 | $593,952 | $281,494 | $312,458 |
| 2017 | $6,436 | $582,307 | $275,975 | $306,332 |
| 2016 | $6,070 | $570,890 | $270,564 | $300,326 |
| 2015 | $5,983 | $562,315 | $266,500 | $295,815 |
| 2014 | $5,761 | $551,301 | $261,280 | $290,021 |
Source: Public Records
Map
Nearby Homes
- 1642 Northwood Rd
- 1658 Waterview Place
- 931 Jacqueline Place
- 957 Jacqueline Place
- 1772 Waterview Place
- 1835 Northwood Rd
- 1695 Trilogy Pkwy
- 1705 Louise Ln
- 808 Albert Way
- 708 Albert Way
- 1155 Spring Azure Way
- 1849 Eucalyptus Rd
- 1159 Spring Azure Way
- 1003 Joseph Ct
- 678 Woodgreen Way
- 1804 Tomas Ct
- 1175 Danielle Ct
- 1071 Ford Dr
- 1471 Via Vista
- 1060 Dawn Rd
Your Personal Tour Guide
Ask me questions while you tour the home.