Estimated Value: $523,000 - $571,000
4
Beds
3
Baths
2,050
Sq Ft
$263/Sq Ft
Est. Value
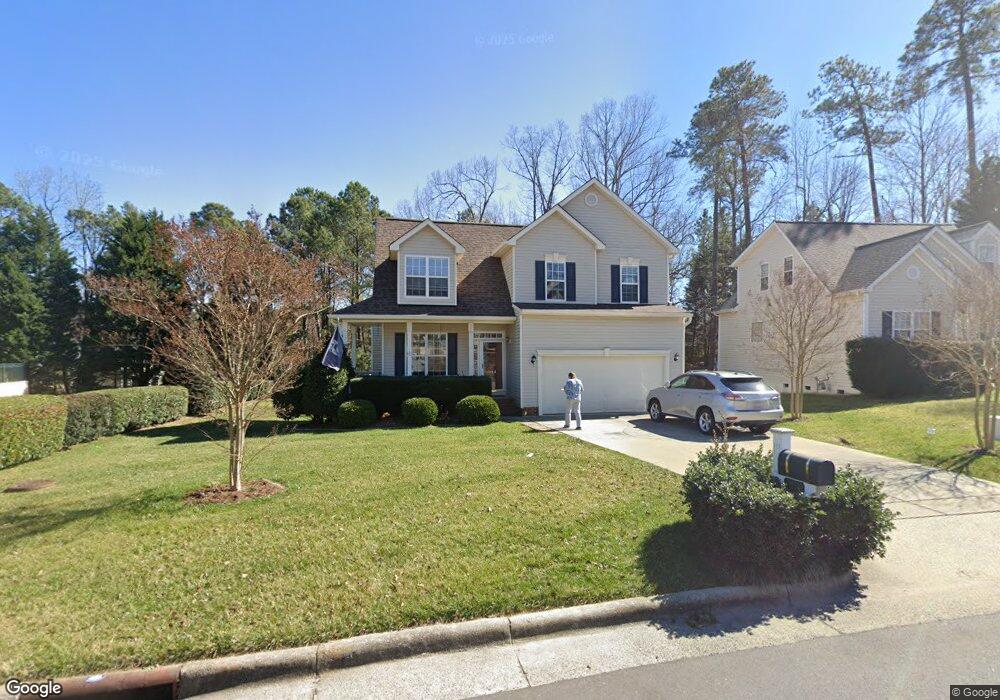
About This Home
This home is located at 920 Bryan Dr, Apex, NC 27502 and is currently estimated at $538,338, approximately $262 per square foot. 920 Bryan Dr is a home located in Wake County with nearby schools including Baucom Elementary School, Apex Middle, and Apex High School.
Ownership History
Date
Name
Owned For
Owner Type
Purchase Details
Closed on
Jan 29, 2019
Sold by
Giamoni Michael J
Bought by
Sleight Sarah E and Muecke Peter K
Current Estimated Value
Purchase Details
Closed on
Jan 28, 2004
Sold by
Silluzio Thomas V and Silluzio Ginene
Bought by
Giamoni Michael J
Home Financials for this Owner
Home Financials are based on the most recent Mortgage that was taken out on this home.
Original Mortgage
$162,000
Interest Rate
5%
Mortgage Type
Purchase Money Mortgage
Purchase Details
Closed on
Apr 28, 2000
Sold by
Anderson Homes Inc
Bought by
Silluzio Thomas
Home Financials for this Owner
Home Financials are based on the most recent Mortgage that was taken out on this home.
Original Mortgage
$30,000
Interest Rate
8.23%
Create a Home Valuation Report for This Property
The Home Valuation Report is an in-depth analysis detailing your home's value as well as a comparison with similar homes in the area
Purchase History
| Date | Buyer | Sale Price | Title Company |
|---|---|---|---|
| Sleight Sarah E | $277,500 | None Available | |
| Giamoni Michael J | $202,500 | -- | |
| Silluzio Thomas | $38,000 | -- |
Source: Public Records
Mortgage History
| Date | Status | Borrower | Loan Amount |
|---|---|---|---|
| Previous Owner | Giamoni Michael J | $162,000 | |
| Previous Owner | Silluzio Thomas | $30,000 | |
| Closed | Giamoni Michael J | $40,500 |
Source: Public Records
Tax History
| Year | Tax Paid | Tax Assessment Tax Assessment Total Assessment is a certain percentage of the fair market value that is determined by local assessors to be the total taxable value of land and additions on the property. | Land | Improvement |
|---|---|---|---|---|
| 2025 | $4,185 | $476,997 | $200,000 | $276,997 |
| 2024 | $4,091 | $476,997 | $200,000 | $276,997 |
Source: Public Records
Map
Nearby Homes
- 101 Rocklyn Ln
- 303 Cameron Glen Dr
- 0 Jb Morgan Rd Unit 10051948
- 1006 Cherokee Sunset Rd
- 1108 Elbury Dr
- 1105 Capitata Crossing
- 111 Lemon Drop Cir
- 1306 Grappenhall Dr
- 104 Fair Spring Ct
- 1008 Daresbury Dr
- 402 Village Loop Dr
- 400 Village Loop Dr
- 203 Milky Way Dr
- 506 W Chatham St
- 1209 Haywards Heath Ln
- 440 Oak Pine Dr
- 102 Licorice Dr
- 3021 White Cloud Cir
- 120 Licorice Dr
- 1303 Goldspot Ct
- 924 Bryan Dr
- 915 Bryan Dr
- 201 Pikeview Ln
- 909 Bryan Dr
- 105 Rocklyn Ln
- 711 Midsummer Ln
- 711 Mid Summer Ln
- 713 Mid Summer Ln
- 117 Rocklyn Ln
- 709 Mid Summer Ln
- 715 Mid Summer Ln
- 715 Midsummer Ln
- 115 Rocklyn Ln
- 707 Midsummer Ln
- 205 Pikeview Ln
- 707 Mid Summer Ln
- 717 Mid Summer Ln
- 717 Midsummer Ln
- 906 Bristol Blue St
- 705 Midsummer Ln
Your Personal Tour Guide
Ask me questions while you tour the home.