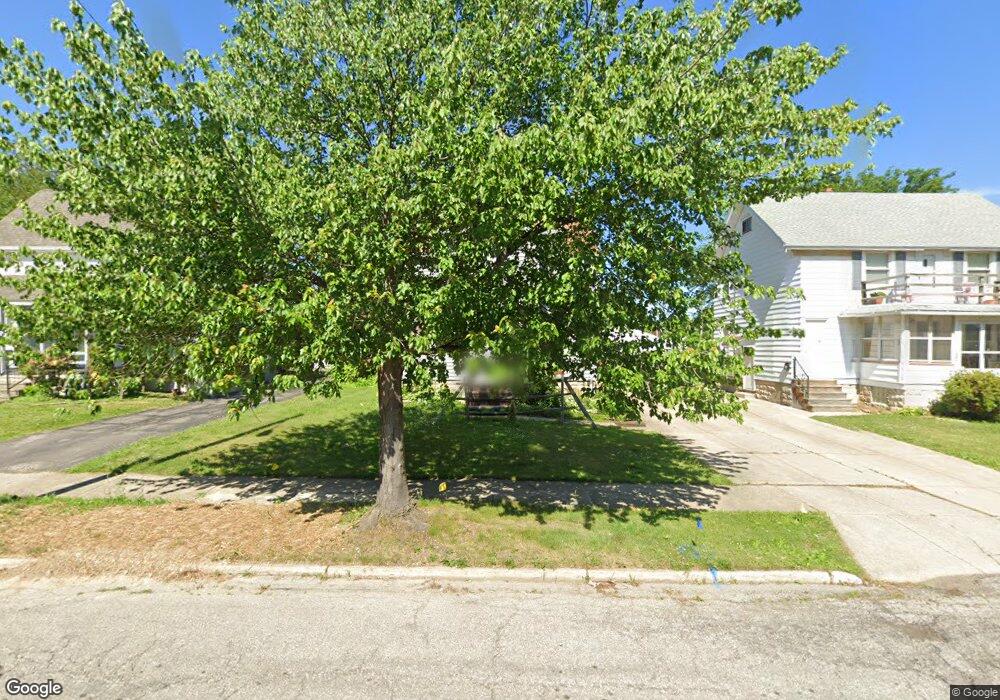
920 E 239th St Euclid, OH 44123
Estimated Value: $129,011 - $163,000
3
Beds
1
Bath
1,328
Sq Ft
$106/Sq Ft
Est. Value
About This Home
This home is located at 920 E 239th St, Euclid, OH 44123 and is currently estimated at $140,753, approximately $105 per square foot. 920 E 239th St is a home located in Cuyahoga County with nearby schools including Arbor Elementary School, Euclid Middle School, and Euclid High School.
Ownership History
Date
Name
Owned For
Owner Type
Purchase Details
Closed on
Jan 13, 2023
Sold by
Miller Kimberly S and Vance Kimberly S
Bought by
Vance Kimberly S
Current Estimated Value
Home Financials for this Owner
Home Financials are based on the most recent Mortgage that was taken out on this home.
Original Mortgage
$87,098
Outstanding Balance
$83,931
Interest Rate
6.75%
Mortgage Type
FHA
Estimated Equity
$56,822
Purchase Details
Closed on
Jan 17, 2002
Sold by
Miller Kenneth J
Bought by
Miller Kimberly S
Home Financials for this Owner
Home Financials are based on the most recent Mortgage that was taken out on this home.
Original Mortgage
$80,750
Interest Rate
8.95%
Mortgage Type
Purchase Money Mortgage
Purchase Details
Closed on
Oct 30, 1978
Sold by
Haffer Paul A
Bought by
Parkinson William
Purchase Details
Closed on
Jan 1, 1975
Bought by
Haffer Paul A
Create a Home Valuation Report for This Property
The Home Valuation Report is an in-depth analysis detailing your home's value as well as a comparison with similar homes in the area
Home Values in the Area
Average Home Value in this Area
Purchase History
| Date | Buyer | Sale Price | Title Company |
|---|---|---|---|
| Vance Kimberly S | -- | Vantage Point Title | |
| Miller Kimberly S | -- | Titleco Title Agency | |
| Parkinson William | $46,000 | -- | |
| Haffer Paul A | -- | -- |
Source: Public Records
Mortgage History
| Date | Status | Borrower | Loan Amount |
|---|---|---|---|
| Open | Vance Kimberly S | $87,098 | |
| Previous Owner | Miller Kimberly S | $80,750 |
Source: Public Records
Tax History
| Year | Tax Paid | Tax Assessment Tax Assessment Total Assessment is a certain percentage of the fair market value that is determined by local assessors to be the total taxable value of land and additions on the property. | Land | Improvement |
|---|---|---|---|---|
| 2025 | $2,671 | $39,760 | $9,590 | $30,170 |
| 2024 | $2,753 | $39,760 | $9,590 | $30,170 |
| 2023 | $2,291 | $26,150 | $7,560 | $18,590 |
| 2022 | $2,240 | $26,150 | $7,560 | $18,590 |
| 2021 | $2,487 | $26,150 | $7,560 | $18,590 |
| 2020 | $2,094 | $19,810 | $5,740 | $14,070 |
| 2019 | $1,879 | $56,600 | $16,400 | $40,200 |
| 2018 | $1,806 | $19,810 | $5,740 | $14,070 |
| 2017 | $1,859 | $16,170 | $3,780 | $12,390 |
| 2016 | $1,863 | $16,170 | $3,780 | $12,390 |
| 2015 | $1,700 | $16,170 | $3,780 | $12,390 |
| 2014 | $1,700 | $16,170 | $3,780 | $12,390 |
Source: Public Records
Map
Nearby Homes
- 942 E 236th St
- 797 Babbitt Rd Unit 15
- 22931 Arms Ave
- 890 E 250th St
- 934 E 223rd St
- 442 Clearview Dr Unit U9
- 21971 Crystal Ave
- 24431 Hartland Rd
- 521 Kenwood Dr Unit B-5
- 22751 Fox Ave
- 21670 Crystal Ave
- 1471 Hall Ct
- 422 Clearview Dr Unit J10
- 21481 Ball Ave
- 1437 E 252nd St
- 21300 Wilmore Ave
- 21840 Miller Ave
- 21391 Westport Ave
- 828 E 216th St
- 450 Kenwood Dr Unit D-12
Your Personal Tour Guide
Ask me questions while you tour the home.