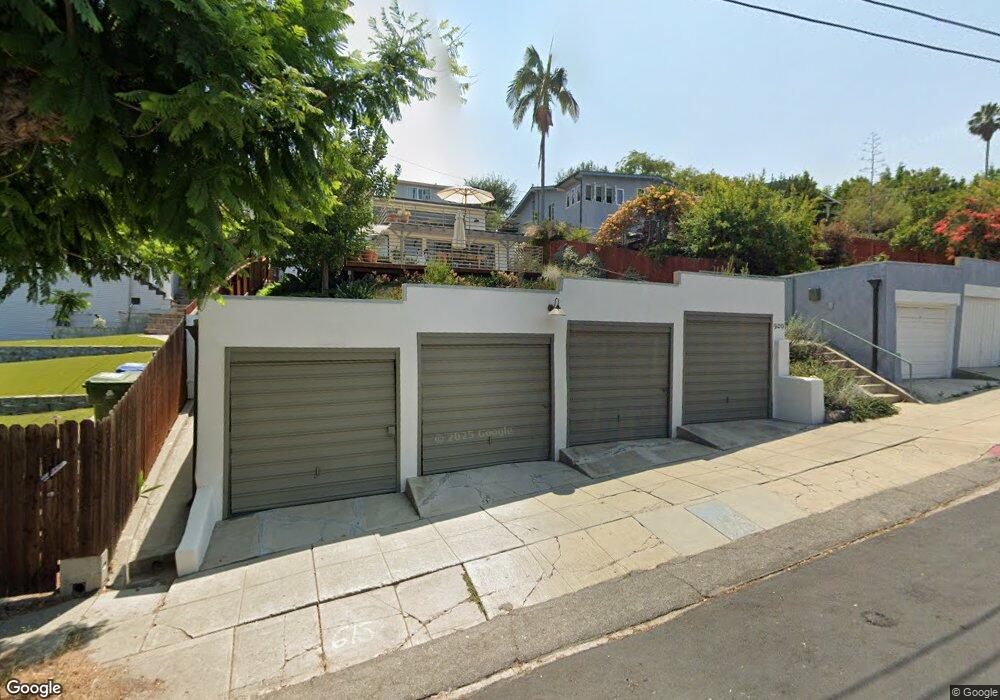
920 Hyperion Ave Los Angeles, CA 90029
Estimated Value: $1,268,000 - $1,889,249
3
Beds
2
Baths
2,007
Sq Ft
$778/Sq Ft
Est. Value
About This Home
This home is located at 920 Hyperion Ave, Los Angeles, CA 90029 and is currently estimated at $1,561,812, approximately $778 per square foot. 920 Hyperion Ave is a home located in Los Angeles County with nearby schools including Lockwood Avenue Elementary School, Thomas Starr King Middle School Film and Media Magnet, and John Marshall Senior High.
Ownership History
Date
Name
Owned For
Owner Type
Purchase Details
Closed on
Oct 12, 2023
Sold by
Farah Michael and Farah Natalie
Bought by
Community Trust and Farah
Current Estimated Value
Purchase Details
Closed on
May 29, 2019
Sold by
Farah Michael N
Bought by
Major Holdings 2019 Llc
Purchase Details
Closed on
Mar 3, 2016
Sold by
Vance Michael
Bought by
Farah Michael N
Home Financials for this Owner
Home Financials are based on the most recent Mortgage that was taken out on this home.
Original Mortgage
$800,000
Interest Rate
3.65%
Mortgage Type
New Conventional
Purchase Details
Closed on
Sep 6, 2003
Sold by
Vance Lucile G
Bought by
Vance Lucile G and The Lucile G Vance Trust
Create a Home Valuation Report for This Property
The Home Valuation Report is an in-depth analysis detailing your home's value as well as a comparison with similar homes in the area
Home Values in the Area
Average Home Value in this Area
Purchase History
| Date | Buyer | Sale Price | Title Company |
|---|---|---|---|
| Community Trust | -- | None Listed On Document | |
| Farah Michael | -- | None Listed On Document | |
| Major Holdings 2019 Llc | -- | None Available | |
| Farah Michael N | $1,100,000 | Old Republic Title Company | |
| Vance Lucile G | -- | -- |
Source: Public Records
Mortgage History
| Date | Status | Borrower | Loan Amount |
|---|---|---|---|
| Previous Owner | Farah Michael N | $800,000 |
Source: Public Records
Tax History Compared to Growth
Tax History
| Year | Tax Paid | Tax Assessment Tax Assessment Total Assessment is a certain percentage of the fair market value that is determined by local assessors to be the total taxable value of land and additions on the property. | Land | Improvement |
|---|---|---|---|---|
| 2025 | $15,730 | $1,448,400 | $1,122,000 | $326,400 |
| 2024 | $15,730 | $1,276,638 | $1,044,524 | $232,114 |
| 2023 | $15,426 | $1,251,607 | $1,024,044 | $227,563 |
| 2022 | $14,710 | $1,227,066 | $1,003,965 | $223,101 |
| 2021 | $14,531 | $1,203,007 | $984,280 | $218,727 |
| 2020 | $14,679 | $1,190,673 | $974,188 | $216,485 |
| 2019 | $14,097 | $1,167,328 | $955,087 | $212,241 |
| 2018 | $13,962 | $1,144,440 | $936,360 | $208,080 |
| 2016 | $1,120 | $80,836 | $24,208 | $56,628 |
| 2015 | $1,106 | $79,623 | $23,845 | $55,778 |
| 2014 | $1,123 | $78,064 | $23,378 | $54,686 |
Source: Public Records
Map
Nearby Homes
- 910 Rector Place
- 975 Lucile Ave
- 967 Lucile Ave
- 916 Sanborn Ave
- 962 N Hoover St
- 970 N Hoover St
- 971 Manzanita St
- 816 Hyperion Ave
- 1018 Manzanita St
- 1016 Manzanita St
- 4005 Monroe St Unit 10
- 3924 W Sunset Blvd
- 1128 N Commonwealth Ave
- 4202 Lexington Ave
- 4307 Burns Ave
- 827 Lucile Ave
- 1145 N Hoover St
- 3432 Larissa Dr
- 1127 N Commonwealth Ave
- 718 N Hoover St
- 916 Hyperion Ave
- 926 Hyperion Ave
- 912 Hyperion Ave
- 932 Hyperion Ave
- 938 Hyperion Ave
- 906 Hyperion Ave Unit 2
- 906 Hyperion Ave Unit 4
- 906 Hyperion Ave Unit 3
- 906 Hyperion Ave Unit 1
- 1327 Lucile Ave
- 908 Hyperion Ave
- 1333 Lucile Ave
- 929 Hyperion Ave Unit 929.75
- 913 Hyperion Ave
- 942 Hyperion Ave
- 921 Hyperion Ave
- 1337 Lucile Ave
- 1307 Lucile Ave
- 927 Hyperion Ave
- 917 Hyperion Ave