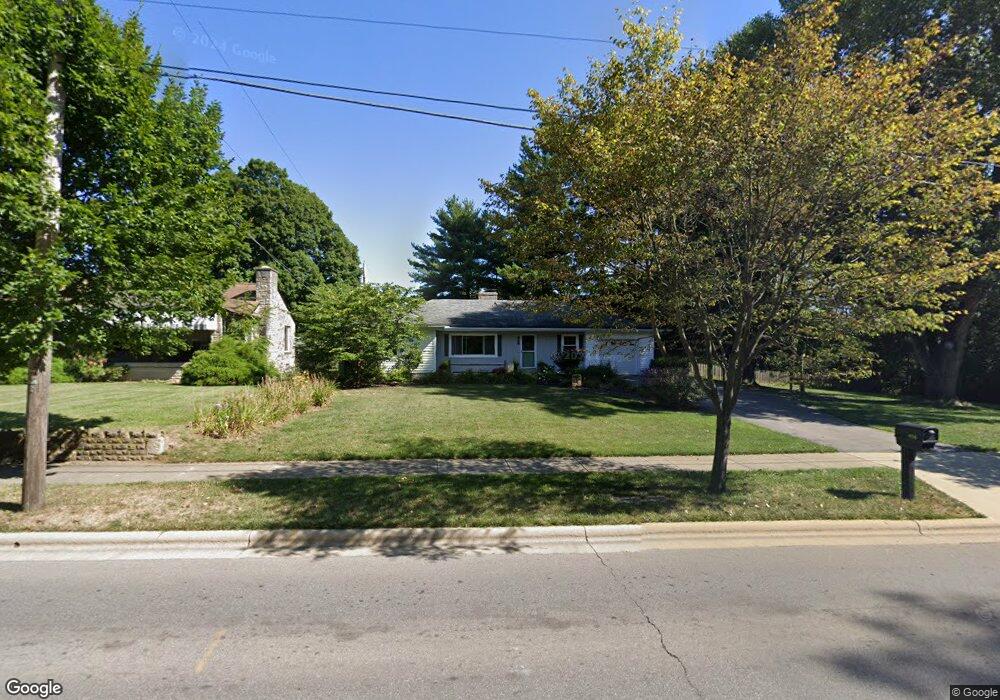
920 Main St Groveport, OH 43125
Estimated Value: $243,000 - $300,000
2
Beds
1
Bath
1,252
Sq Ft
$218/Sq Ft
Est. Value
About This Home
This home is located at 920 Main St, Groveport, OH 43125 and is currently estimated at $272,672, approximately $217 per square foot. 920 Main St is a home located in Franklin County with nearby schools including Groveport Madison High School, Groveport Community School, and Madison Christian School.
Ownership History
Date
Name
Owned For
Owner Type
Purchase Details
Closed on
Aug 20, 2019
Sold by
Chaffin Floyd L
Bought by
Dye Cheryl L
Current Estimated Value
Purchase Details
Closed on
Apr 25, 2014
Sold by
Chaffin Lori
Bought by
Chaffin Floyd L
Purchase Details
Closed on
Jul 14, 2011
Sold by
Estate Of Virginia Lewis
Bought by
Chaffin Lori
Purchase Details
Closed on
Apr 13, 1982
Bought by
Lewis Virginia
Create a Home Valuation Report for This Property
The Home Valuation Report is an in-depth analysis detailing your home's value as well as a comparison with similar homes in the area
Home Values in the Area
Average Home Value in this Area
Purchase History
| Date | Buyer | Sale Price | Title Company |
|---|---|---|---|
| Dye Cheryl L | $177,000 | Bridge T&E Svcs Llc | |
| Chaffin Floyd L | -- | None Available | |
| Chaffin Lori | -- | None Available | |
| Lewis Virginia | -- | -- |
Source: Public Records
Tax History Compared to Growth
Tax History
| Year | Tax Paid | Tax Assessment Tax Assessment Total Assessment is a certain percentage of the fair market value that is determined by local assessors to be the total taxable value of land and additions on the property. | Land | Improvement |
|---|---|---|---|---|
| 2024 | $3,492 | $71,400 | $23,800 | $47,600 |
| 2023 | $3,461 | $71,400 | $23,800 | $47,600 |
| 2022 | $3,798 | $62,510 | $16,730 | $45,780 |
| 2021 | $3,812 | $62,510 | $16,730 | $45,780 |
| 2020 | $3,821 | $62,510 | $16,730 | $45,780 |
| 2019 | $2,996 | $51,950 | $13,970 | $37,980 |
| 2018 | $2,765 | $51,950 | $13,970 | $37,980 |
| 2017 | $3,019 | $51,950 | $13,970 | $37,980 |
| 2016 | $2,495 | $41,170 | $11,170 | $30,000 |
| 2015 | $2,857 | $41,170 | $11,170 | $30,000 |
| 2014 | $2,369 | $41,170 | $11,170 | $30,000 |
| 2013 | $1,077 | $43,330 | $11,760 | $31,570 |
Source: Public Records
Map
Nearby Homes
- 213 Front St
- 135 Front St
- 7474 Groveport Rd
- 287 College St
- 218-222 Center St
- 430 Maple St
- 5777 Ebright Rd
- 199 Mohr Ave
- 250 Green Ave
- 303 Madison St
- 4822 Elmont Place
- 5310 Sims Rd
- 5652 Red Alder St
- 5634 Shagbark Place
- 5611 Shellbark St
- 5156 Sand Ct
- 5151 Bixby Rd
- 5516 Harriet St
- 5424 Bixby Rd
- 5157 Bixford Ave