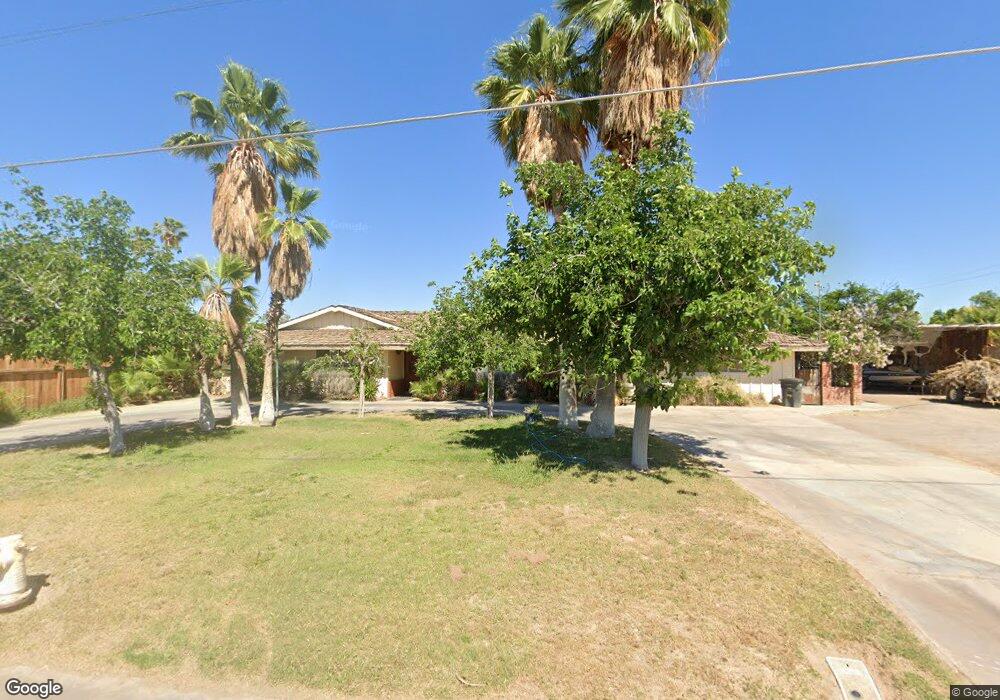
920 N Lovekin Blvd Blythe, CA 92225
Estimated Value: $180,000 - $539,000
7
Beds
4
Baths
3,801
Sq Ft
$83/Sq Ft
Est. Value
About This Home
This home is located at 920 N Lovekin Blvd, Blythe, CA 92225 and is currently estimated at $313,667, approximately $82 per square foot. 920 N Lovekin Blvd is a home located in Riverside County with nearby schools including Palo Verde High School and Scale Leadership Academy - East.
Ownership History
Date
Name
Owned For
Owner Type
Purchase Details
Closed on
Jul 16, 2025
Sold by
Vasquez Ortencia Trust
Bought by
Palo Verde Irrigation District
Current Estimated Value
Purchase Details
Closed on
Jul 17, 2024
Sold by
Vasquez Ortencia Trust
Bought by
Palo Verde Irrigation District
Purchase Details
Closed on
Oct 9, 2023
Sold by
Vasquez Ortencia Trust
Bought by
Palo Verde Irrigation District
Purchase Details
Closed on
Jul 31, 2018
Sold by
Graham Jeremy A
Bought by
Vasquez Matthew
Home Financials for this Owner
Home Financials are based on the most recent Mortgage that was taken out on this home.
Interest Rate
4.54%
Purchase Details
Closed on
Jan 11, 1996
Sold by
Vasquez Ortencia G
Bought by
Vasquez Ortencia G
Purchase Details
Closed on
Aug 18, 1995
Sold by
Vasquez Ortencia G
Bought by
Vasquez Ortencia G
Purchase Details
Closed on
May 6, 1995
Sold by
Vasquez Ortencia G
Bought by
Vasquez Ortencia G and Vasquez Ortencia Gonzales
Create a Home Valuation Report for This Property
The Home Valuation Report is an in-depth analysis detailing your home's value as well as a comparison with similar homes in the area
Home Values in the Area
Average Home Value in this Area
Purchase History
| Date | Buyer | Sale Price | Title Company |
|---|---|---|---|
| Palo Verde Irrigation District | -- | -- | |
| Palo Verde Irrigation District | -- | -- | |
| Palo Verde Irrigation District | -- | -- | |
| Vasquez Matthew | -- | -- | |
| Vasquez Ortencia G | -- | -- | |
| Vasquez Ortencia G | -- | Gateway Title Company | |
| Vasquez Ortencia G | -- | -- | |
| Vasquez Ortencia G | -- | -- |
Source: Public Records
Mortgage History
| Date | Status | Borrower | Loan Amount |
|---|---|---|---|
| Closed | Vasquez Matthew | -- | |
| Closed | Vasquez Matthew | $0 |
Source: Public Records
Tax History Compared to Growth
Tax History
| Year | Tax Paid | Tax Assessment Tax Assessment Total Assessment is a certain percentage of the fair market value that is determined by local assessors to be the total taxable value of land and additions on the property. | Land | Improvement |
|---|---|---|---|---|
| 2025 | $1,466 | $138,080 | $24,320 | $113,760 |
| 2023 | $1,466 | $132,721 | $23,377 | $109,344 |
| 2022 | $1,406 | $130,119 | $22,919 | $107,200 |
| 2021 | $1,368 | $127,569 | $22,470 | $105,099 |
| 2020 | $1,354 | $126,262 | $22,240 | $104,022 |
| 2019 | $1,341 | $123,787 | $21,804 | $101,983 |
| 2018 | $1,255 | $121,361 | $21,377 | $99,984 |
| 2017 | $1,228 | $118,982 | $20,958 | $98,024 |
| 2016 | $1,215 | $116,650 | $20,548 | $96,102 |
| 2015 | $1,202 | $114,900 | $20,241 | $94,659 |
| 2014 | $1,156 | $112,651 | $19,846 | $92,805 |
Source: Public Records
Map
Nearby Homes
- 570 Holley Ln
- 1020 N Lovekin Blvd Unit 38
- 560 Parker Place
- 1030 N Lovekin Blvd Unit 27
- 491 W Montezuma St
- 521 W Oregon St
- 251 W Juniper Trail
- 507 W Nevada St
- 1154 Catalina Dr
- 821 Cypress Ln
- 641 Ocotillo Rd
- 11333 Desert Trailways Ln
- 491 N Willow St
- 11408 Desert Trailways Ln
- 10916 W 10th Ave
- 650 10th Ave
- 470 N Willow St
- 161 Eunice Cir
- 173 Eunice Cir
- 410 N Lovekin Blvd
- 791 Seville Ln
- 731 Seville Ln
- 930 N Lovekin Blvd
- 721 Seville Ln
- 0 1 Desert Dirt Rd Unit 18-300106PS
- 0 1 Desert Dirt Rd Unit 219098991PS
- 0 1 Desert Dirt Rd Unit 219095209PS
- 0 1 Desert Dirt Rd Unit 219062198
- 0 1 Desert Dirt Rd Unit 219037319
- 0 1 Desert Dirt Rd Unit 18300106DA
- 0 1 Desert Dirt Rd Unit 19432316DA
- 0 1 Desert Dirt Rd Unit 19-432316PS
- 790 Seville Ln
- 760 Seville Ln
- 691 Seville Ln
- 730 Seville Ln
- 791 Holley Ln
- 690 Seville Ln
- 781 Holley Ln
- 661 Seville Ln