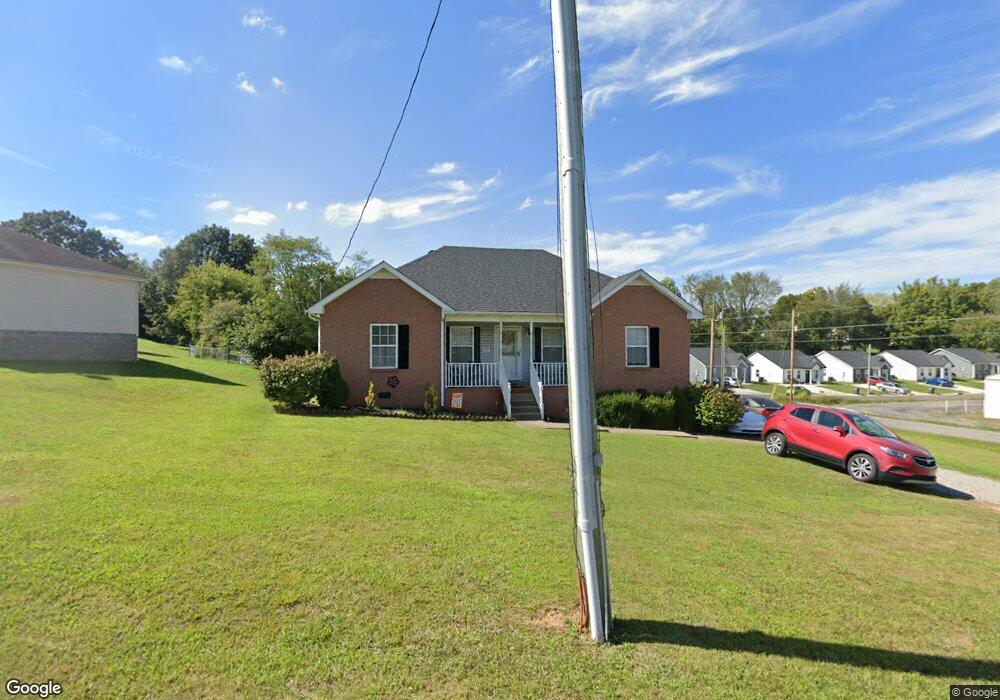
920 Spruce St Springfield, TN 37172
Estimated Value: $230,882 - $265,000
Studio
2
Baths
1,240
Sq Ft
$199/Sq Ft
Est. Value
About This Home
This home is located at 920 Spruce St, Springfield, TN 37172 and is currently estimated at $246,221, approximately $198 per square foot. 920 Spruce St is a home located in Robertson County with nearby schools including Krisle Elementary School, Innovation Academy, and Springfield High School.
Ownership History
Date
Name
Owned For
Owner Type
Purchase Details
Closed on
Oct 3, 2003
Sold by
Ozanne Larry
Bought by
Terry Deborah A
Current Estimated Value
Home Financials for this Owner
Home Financials are based on the most recent Mortgage that was taken out on this home.
Original Mortgage
$91,500
Outstanding Balance
$41,761
Interest Rate
6.24%
Estimated Equity
$204,460
Purchase Details
Closed on
Jun 18, 2002
Bought by
Ozanne Larry
Create a Home Valuation Report for This Property
The Home Valuation Report is an in-depth analysis detailing your home's value as well as a comparison with similar homes in the area
Home Values in the Area
Average Home Value in this Area
Purchase History
| Date | Buyer | Sale Price | Title Company |
|---|---|---|---|
| Terry Deborah A | $91,500 | -- | |
| Ozanne Larry | $37,000 | -- |
Source: Public Records
Mortgage History
| Date | Status | Borrower | Loan Amount |
|---|---|---|---|
| Open | Ozanne Larry | $91,500 |
Source: Public Records
Tax History
| Year | Tax Paid | Tax Assessment Tax Assessment Total Assessment is a certain percentage of the fair market value that is determined by local assessors to be the total taxable value of land and additions on the property. | Land | Improvement |
|---|---|---|---|---|
| 2025 | -- | $52,125 | $15,000 | $37,125 |
| 2024 | -- | $52,125 | $15,000 | $37,125 |
| 2023 | $1,306 | $52,125 | $15,000 | $37,125 |
| 2022 | $1,099 | $30,125 | $3,450 | $26,675 |
| 2021 | $1,099 | $30,125 | $3,450 | $26,675 |
| 2020 | $1,099 | $30,125 | $3,450 | $26,675 |
| 2019 | $33,076 | $30,125 | $3,450 | $26,675 |
| 2018 | $1,099 | $30,125 | $3,450 | $26,675 |
| 2017 | $1,070 | $24,975 | $2,550 | $22,425 |
| 2016 | $1,070 | $24,975 | $2,550 | $22,425 |
| 2015 | $1,039 | $24,975 | $2,550 | $22,425 |
| 2014 | $1,039 | $24,975 | $2,550 | $22,425 |
Source: Public Records
Map
Nearby Homes
- 906 Spruce St
- 703 Hayes St
- 54 Hunters Ln
- 805 8th Ave E
- 415 Durrett St
- 1 Tom Austin Hwy
- 952 N Brown St
- 817 N Brown St
- 401 S Pawnee Dr
- 1711 Woodside Dr
- 811 17th Ave E
- 305 S Pawnee Dr
- 514 Lakeside Dr
- 2511 Queen Anne Ct
- 633 E 17th Ave
- 793 Spring Cir
- 109 E 7th Ave
- 342 Crescent Dr
- 5295 Matthews St
- 1205 S Main St
Your Personal Tour Guide
Ask me questions while you tour the home.