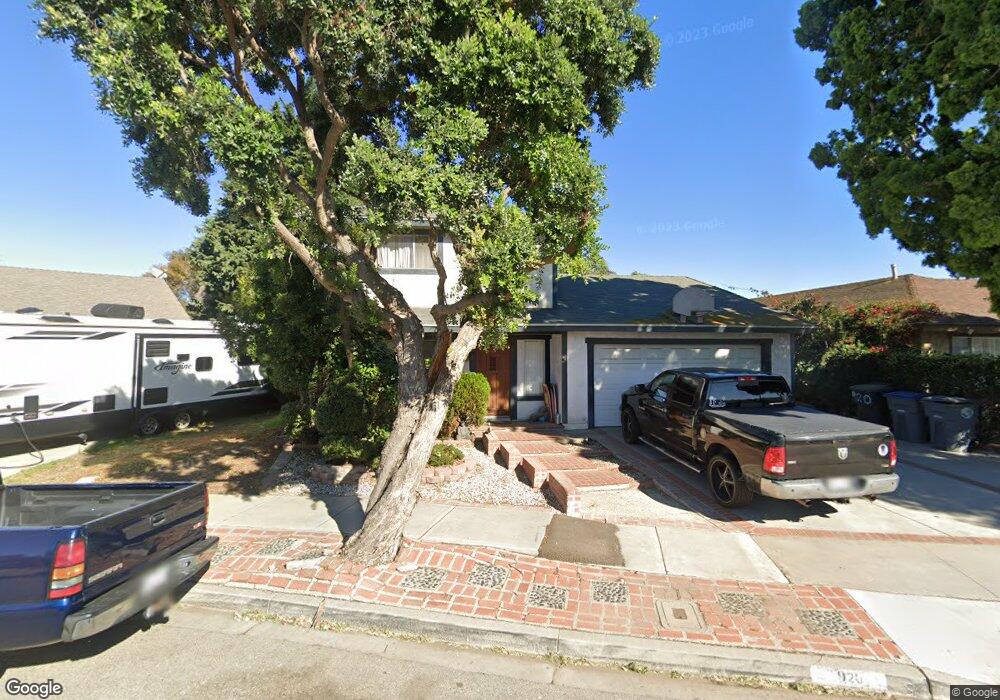
920 Topsail Ct Oxnard, CA 93035
Sea View Estates NeighborhoodEstimated Value: $691,000 - $930,000
4
Beds
2
Baths
1,863
Sq Ft
$435/Sq Ft
Est. Value
About This Home
This home is located at 920 Topsail Ct, Oxnard, CA 93035 and is currently estimated at $810,719, approximately $435 per square foot. 920 Topsail Ct is a home located in Ventura County with nearby schools including Juan Lagunas Soria Elementary School and Oxnard High School.
Ownership History
Date
Name
Owned For
Owner Type
Purchase Details
Closed on
Mar 27, 2015
Sold by
Grey Cecilia B
Bought by
Grey Antonio
Current Estimated Value
Home Financials for this Owner
Home Financials are based on the most recent Mortgage that was taken out on this home.
Original Mortgage
$40,000
Outstanding Balance
$30,815
Interest Rate
3.76%
Mortgage Type
Credit Line Revolving
Estimated Equity
$779,904
Purchase Details
Closed on
Jan 19, 1994
Sold by
Grey Mary B
Bought by
Grey Antonio
Home Financials for this Owner
Home Financials are based on the most recent Mortgage that was taken out on this home.
Original Mortgage
$120,000
Interest Rate
7.1%
Create a Home Valuation Report for This Property
The Home Valuation Report is an in-depth analysis detailing your home's value as well as a comparison with similar homes in the area
Home Values in the Area
Average Home Value in this Area
Purchase History
| Date | Buyer | Sale Price | Title Company |
|---|---|---|---|
| Grey Antonio | -- | Fidelity National Title | |
| Grey Antonio | -- | Chicago Title Co |
Source: Public Records
Mortgage History
| Date | Status | Borrower | Loan Amount |
|---|---|---|---|
| Open | Grey Antonio | $40,000 | |
| Open | Grey Antonio | $161,000 | |
| Closed | Grey Antonio | $120,000 |
Source: Public Records
Tax History
| Year | Tax Paid | Tax Assessment Tax Assessment Total Assessment is a certain percentage of the fair market value that is determined by local assessors to be the total taxable value of land and additions on the property. | Land | Improvement |
|---|---|---|---|---|
| 2025 | $1,296 | $103,022 | $18,671 | $84,351 |
| 2024 | $1,296 | $101,002 | $18,304 | $82,698 |
| 2023 | $1,250 | $99,022 | $17,945 | $81,077 |
| 2022 | $1,214 | $97,081 | $17,593 | $79,488 |
| 2021 | $54 | $95,178 | $17,248 | $77,930 |
| 2020 | $54 | $94,204 | $17,072 | $77,132 |
| 2019 | $54 | $92,358 | $16,738 | $75,620 |
| 2018 | $54 | $90,548 | $16,410 | $74,138 |
| 2017 | $53 | $88,774 | $16,089 | $72,685 |
| 2016 | $53 | $87,034 | $15,774 | $71,260 |
| 2015 | $53 | $85,729 | $15,538 | $70,191 |
| 2014 | $53 | $84,052 | $15,235 | $68,817 |
Source: Public Records
Map
Nearby Homes
- 3746 Dunkirk Dr
- 4060 Tradewinds Dr
- 3800 Alee Ln
- 1437 Windshore Way
- 1423 Windshore Way
- 1421 Windshore Way
- 2919 Naples Dr
- 1503 Windshore Way
- 1541 Windshore Way
- 1506 Seabridge Ln
- 1423 Caspian Way
- 4234 Tradewinds Dr
- 2923 Kelp Ln Unit 11
- 1365 Donegal Way
- 600 Freeport Ln
- 1170 Windward Way
- 4344 Tradewinds Dr
- 4114 Caribbean St
- 4312 Waterside Ln
- 4320 Waterside Ln
- 910 Topsail Ct
- 855 Shallows Dr
- 3645 Oarfish Ln
- 940 Topsail Ct
- 3720 Nantucket Pkwy
- 3710 Nantucket Pkwy
- 900 Topsail Ct
- 3730 Nantucket Pkwy
- 3700 Nantucket Pkwy
- 905 Topsail Ct
- 931 Topsail Ct
- 3740 Nantucket Pkwy
- 921 Topsail Ct
- 911 Topsail Ct
- 941 Topsail Ct
- 3635 Oarfish Ln
- 3750 Nantucket Pkwy
- 910 Taffrail Ct
- 3680 Nantucket Pkwy
- 3650 Oarfish Ln
Your Personal Tour Guide
Ask me questions while you tour the home.