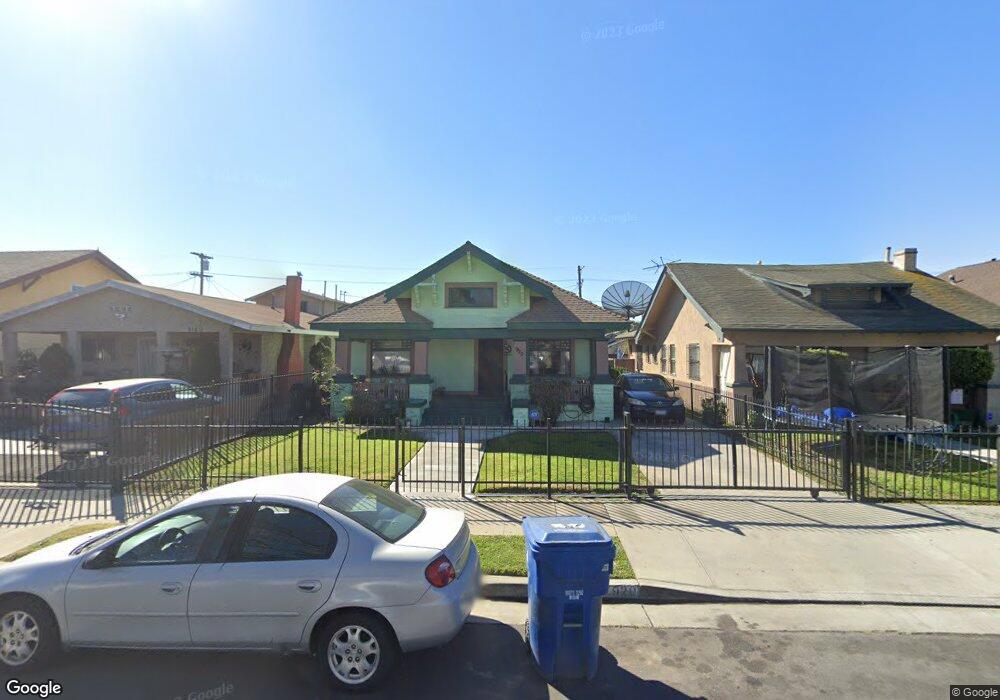
920 W 53rd St Los Angeles, CA 90037
Vermont Square NeighborhoodEstimated Value: $587,000 - $683,000
3
Beds
1
Bath
1,498
Sq Ft
$419/Sq Ft
Est. Value
About This Home
This home is located at 920 W 53rd St, Los Angeles, CA 90037 and is currently estimated at $627,286, approximately $418 per square foot. 920 W 53rd St is a home located in Los Angeles County with nearby schools including Fifty-Second Street Elementary School, John Muir Middle School, and Augustus F. Hawkins High A Critical Design And Gaming.
Ownership History
Date
Name
Owned For
Owner Type
Purchase Details
Closed on
Mar 17, 2006
Sold by
Youngblood Mona D
Bought by
Youngblood Mona D
Current Estimated Value
Home Financials for this Owner
Home Financials are based on the most recent Mortgage that was taken out on this home.
Original Mortgage
$75,000
Interest Rate
6.18%
Mortgage Type
New Conventional
Purchase Details
Closed on
Aug 30, 2004
Sold by
Youngblood Willie M
Bought by
Youngblood Mona D
Create a Home Valuation Report for This Property
The Home Valuation Report is an in-depth analysis detailing your home's value as well as a comparison with similar homes in the area
Home Values in the Area
Average Home Value in this Area
Purchase History
| Date | Buyer | Sale Price | Title Company |
|---|---|---|---|
| Youngblood Mona D | -- | Accommodation | |
| Youngblood Mona D | -- | -- |
Source: Public Records
Mortgage History
| Date | Status | Borrower | Loan Amount |
|---|---|---|---|
| Closed | Youngblood Mona D | $75,000 |
Source: Public Records
Tax History Compared to Growth
Tax History
| Year | Tax Paid | Tax Assessment Tax Assessment Total Assessment is a certain percentage of the fair market value that is determined by local assessors to be the total taxable value of land and additions on the property. | Land | Improvement |
|---|---|---|---|---|
| 2025 | $641 | $37,678 | $23,745 | $13,933 |
| 2024 | $641 | $36,940 | $23,280 | $13,660 |
| 2023 | $636 | $36,217 | $22,824 | $13,393 |
| 2022 | $617 | $35,508 | $22,377 | $13,131 |
| 2021 | $597 | $34,813 | $21,939 | $12,874 |
| 2019 | $583 | $33,783 | $21,290 | $12,493 |
| 2018 | $515 | $33,122 | $20,873 | $12,249 |
| 2016 | $477 | $31,837 | $20,063 | $11,774 |
| 2015 | $471 | $31,360 | $19,762 | $11,598 |
| 2014 | $483 | $30,746 | $19,375 | $11,371 |
Source: Public Records
Map
Nearby Homes