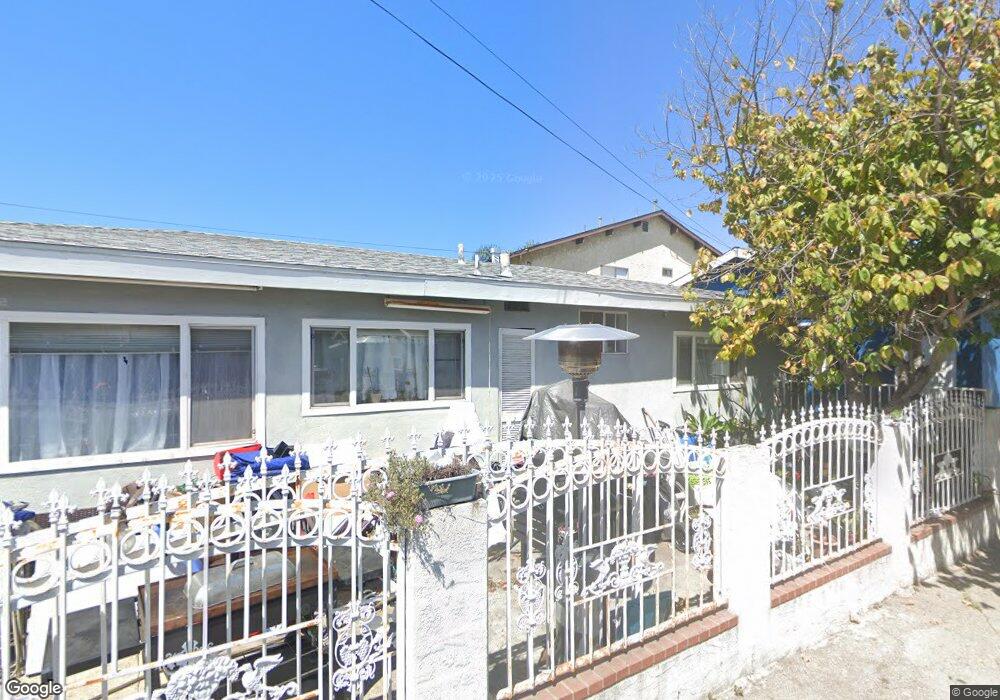
920 W Oliver St San Pedro, CA 90731
Estimated Value: $782,821 - $1,005,000
5
Beds
2
Baths
1,849
Sq Ft
$487/Sq Ft
Est. Value
About This Home
This home is located at 920 W Oliver St, San Pedro, CA 90731 and is currently estimated at $901,205, approximately $487 per square foot. 920 W Oliver St is a home located in Los Angeles County with nearby schools including Bandini Street Elementary School, Rudecinda Sepulveda Dodson Middle, and San Pedro Senior High School.
Ownership History
Date
Name
Owned For
Owner Type
Purchase Details
Closed on
Sep 14, 2004
Sold by
Fonseca Hector and Fonseca Leticia
Bought by
Fonseca Pedro and Fonseca Teresa
Current Estimated Value
Home Financials for this Owner
Home Financials are based on the most recent Mortgage that was taken out on this home.
Original Mortgage
$205,000
Interest Rate
5.94%
Mortgage Type
New Conventional
Purchase Details
Closed on
Jul 28, 1995
Sold by
Citizens Federal Bank Fsb
Bought by
Fonseca Hector and Fonseca Leticia
Home Financials for this Owner
Home Financials are based on the most recent Mortgage that was taken out on this home.
Original Mortgage
$147,353
Interest Rate
7.97%
Mortgage Type
FHA
Purchase Details
Closed on
Mar 10, 1995
Sold by
Carcamo Mark and Carcamo Kathy
Bought by
Citizens Federal Bank
Create a Home Valuation Report for This Property
The Home Valuation Report is an in-depth analysis detailing your home's value as well as a comparison with similar homes in the area
Home Values in the Area
Average Home Value in this Area
Purchase History
| Date | Buyer | Sale Price | Title Company |
|---|---|---|---|
| Fonseca Pedro | -- | Chicago Title Company | |
| Fonseca Hector | $150,000 | First American | |
| Citizens Federal Bank | -- | -- |
Source: Public Records
Mortgage History
| Date | Status | Borrower | Loan Amount |
|---|---|---|---|
| Closed | Fonseca Pedro | $205,000 | |
| Previous Owner | Fonseca Hector | $147,353 |
Source: Public Records
Tax History
| Year | Tax Paid | Tax Assessment Tax Assessment Total Assessment is a certain percentage of the fair market value that is determined by local assessors to be the total taxable value of land and additions on the property. | Land | Improvement |
|---|---|---|---|---|
| 2025 | $3,049 | $249,162 | $90,526 | $158,636 |
| 2024 | $3,049 | $244,277 | $88,751 | $155,526 |
| 2023 | $2,991 | $239,488 | $87,011 | $152,477 |
| 2022 | $2,853 | $234,793 | $85,305 | $149,488 |
| 2021 | $2,806 | $230,190 | $83,633 | $146,557 |
| 2020 | $2,828 | $227,831 | $82,776 | $145,055 |
| 2019 | $2,721 | $223,364 | $81,153 | $142,211 |
| 2018 | $2,636 | $218,985 | $79,562 | $139,423 |
| 2016 | $2,495 | $210,483 | $76,473 | $134,010 |
| 2015 | $2,457 | $207,323 | $75,325 | $131,998 |
| 2014 | $2,475 | $203,263 | $73,850 | $129,413 |
Source: Public Records
Map
Nearby Homes
- 876 W Oliver St
- 884 W Sepulveda St
- 944 W Sepulveda St
- 981 W Oliver St
- 834 W Santa Cruz St
- 932 W Crestwood Ave
- 529 N Leland Ave
- 875 W 1st St
- 784 W 1st St
- 714 W Crestwood Ave
- 701 N Gaffey Place
- 153 N Hanford Ave
- 739 W 2nd St
- 578 W Oliver St
- 952 N Gaffey Place
- 622 W 2nd St
- 1274 W 3rd St
- 514 Arcadia Dr
- 730 W 5th St
- 634 W 4th St
- 932 W Oliver St
- 916 W Oliver St
- 465 N Meyler St
- 938 W Oliver St
- 473 N Meyler St
- 921 W Summerland Ave
- 929 W Summerland Ave
- 933 W Summerland Ave
- 479 N Meyler St
- 913 W Oliver St
- 944 W Oliver St
- 939 W Summerland Ave Unit 1/2
- 939 W Summerland Ave
- 921 W Oliver St
- 927 W Oliver St
- 485 N Meyler St
- 933 W Oliver St
- 427 N Meyler St
- 950 W Oliver St
- 945 W Summerland Ave
Your Personal Tour Guide
Ask me questions while you tour the home.