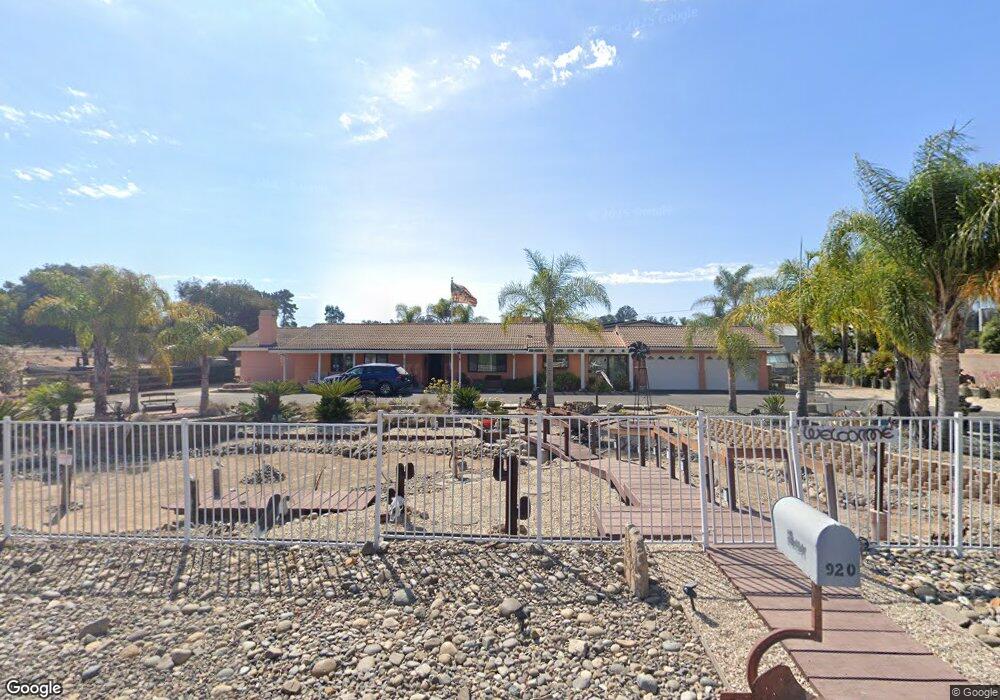
920 Waypoint Dr Nipomo, CA 93444
Estimated Value: $964,000 - $1,191,000
3
Beds
2
Baths
1,800
Sq Ft
$605/Sq Ft
Est. Value
About This Home
This home is located at 920 Waypoint Dr, Nipomo, CA 93444 and is currently estimated at $1,088,767, approximately $604 per square foot. 920 Waypoint Dr is a home located in San Luis Obispo County with nearby schools including Dana Elementary School, Mesa Middle School, and Nipomo High School.
Ownership History
Date
Name
Owned For
Owner Type
Purchase Details
Closed on
Jun 2, 2003
Sold by
Forst Steven D and Forst Marlena K
Bought by
Forst Steven D and Forst Marlena K
Current Estimated Value
Home Financials for this Owner
Home Financials are based on the most recent Mortgage that was taken out on this home.
Original Mortgage
$233,000
Interest Rate
5.53%
Mortgage Type
Purchase Money Mortgage
Purchase Details
Closed on
May 15, 2002
Sold by
Forst Steven D and Forst Marlena K
Bought by
Forst Steven D and Forst Marlena K
Purchase Details
Closed on
Sep 18, 1997
Sold by
Fertig Frank A and Fertig Ruth L
Bought by
Forst Steven D and Forst Marlena K
Home Financials for this Owner
Home Financials are based on the most recent Mortgage that was taken out on this home.
Original Mortgage
$186,400
Interest Rate
7.23%
Purchase Details
Closed on
Oct 24, 1996
Sold by
Fertig Frank A and Fertig Ruth L
Bought by
Fertig Frank A and Fertig Ruth L
Create a Home Valuation Report for This Property
The Home Valuation Report is an in-depth analysis detailing your home's value as well as a comparison with similar homes in the area
Home Values in the Area
Average Home Value in this Area
Purchase History
| Date | Buyer | Sale Price | Title Company |
|---|---|---|---|
| Forst Steven D | -- | Fidelity Title Company | |
| Forst Steven D | -- | Fidelity Title Company | |
| Forst Steven D | -- | -- | |
| Forst Steven D | $233,000 | Chicago Title Co | |
| Fertig Frank A | -- | Fidelity National Title |
Source: Public Records
Mortgage History
| Date | Status | Borrower | Loan Amount |
|---|---|---|---|
| Closed | Forst Steven D | $233,000 | |
| Previous Owner | Forst Steven D | $186,400 |
Source: Public Records
Tax History
| Year | Tax Paid | Tax Assessment Tax Assessment Total Assessment is a certain percentage of the fair market value that is determined by local assessors to be the total taxable value of land and additions on the property. | Land | Improvement |
|---|---|---|---|---|
| 2025 | $4,631 | $457,379 | $167,641 | $289,738 |
| 2024 | $4,577 | $448,411 | $164,354 | $284,057 |
| 2023 | $4,577 | $439,620 | $161,132 | $278,488 |
| 2022 | $4,506 | $431,001 | $157,973 | $273,028 |
| 2021 | $4,496 | $422,551 | $154,876 | $267,675 |
| 2020 | $4,444 | $418,219 | $153,288 | $264,931 |
| 2019 | $4,415 | $410,020 | $150,283 | $259,737 |
| 2018 | $4,361 | $401,982 | $147,337 | $254,645 |
| 2017 | $4,278 | $394,101 | $144,449 | $249,652 |
| 2016 | $4,033 | $386,374 | $141,617 | $244,757 |
| 2015 | $3,975 | $380,571 | $139,490 | $241,081 |
| 2014 | -- | $373,117 | $136,758 | $236,359 |
Source: Public Records
Map
Nearby Homes
- 760 Black Oak Ln
- 940 Calle Fresa
- 1089 Olympic Way
- 1093 Camino Caballo
- 680 Sweet Donna Place
- 1060 Dawn Rd
- 770 & 772 Beverly
- 182 172 E Chestnut
- 1160 Oakmont Place Unit 1
- 1024 Maggie Ln
- 1071 Ford Dr
- 639 Barberry Way
- 1337 Black Sage Cir
- 745 Inga Rd
- 1255 Viva Way
- 219 Lema Dr
- 850 Primrose Ln
- 1276 Pomeroy Rd
- 228 Chaparral Ln
- 161 Lot Scenic View Way
- 910 Waypoint Dr
- 892 Peggy Lee Ct
- 940 Waypoint Dr
- 935 Waypoint Dr
- 882 Peggy Lee Ct
- 890 Via Seco Unit lot 2
- 890 Via Seco
- 919 Calle Roble Unit lot 3
- 919 Calle Roble
- 936 Via Seco Unit lot16
- 950 Waypoint Dr
- 910 Pomeroy Rd
- 945 Pomeroy Rd
- 929 Calle Roble Unit lot 4
- 929 Calle Roble
- 883 Peggy Lee Ct
- 890 Pomeroy Rd
- 872 Peggy Lee Ct
- 939 Calle Roble Unit lot 5
Your Personal Tour Guide
Ask me questions while you tour the home.