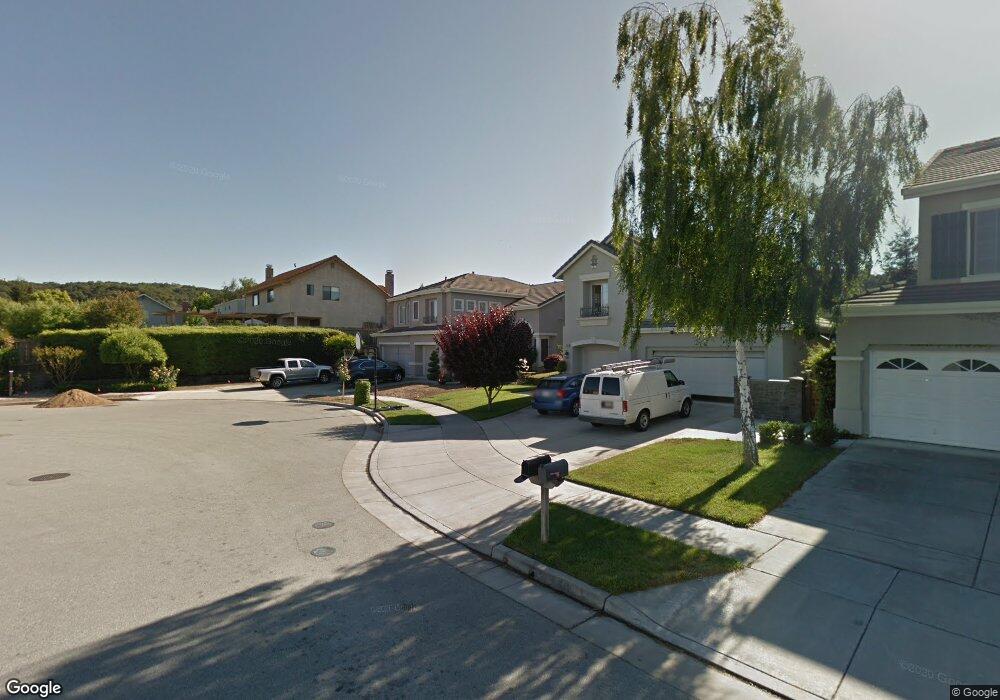
9201 Twinberry Way Gilroy, CA 95020
Las Animas NeighborhoodEstimated Value: $1,157,912 - $1,267,000
4
Beds
3
Baths
2,274
Sq Ft
$523/Sq Ft
Est. Value
About This Home
This home is located at 9201 Twinberry Way, Gilroy, CA 95020 and is currently estimated at $1,189,978, approximately $523 per square foot. 9201 Twinberry Way is a home located in Santa Clara County with nearby schools including Luigi Aprea Elementary School, Brownell Middle School, and Solorsano Middle School.
Ownership History
Date
Name
Owned For
Owner Type
Purchase Details
Closed on
Jun 4, 2025
Sold by
Hicks Robert E and Hicks Marie E
Bought by
Hicks Living Trust and Hicks
Current Estimated Value
Purchase Details
Closed on
Sep 13, 2000
Sold by
Hicks Robert E and Eric Robert
Bought by
Hicks Robert E and Hicks Marie E
Home Financials for this Owner
Home Financials are based on the most recent Mortgage that was taken out on this home.
Original Mortgage
$425,000
Interest Rate
8.07%
Mortgage Type
Stand Alone First
Purchase Details
Closed on
Oct 7, 1999
Sold by
Archer Pamela
Bought by
Archer Jerry J
Purchase Details
Closed on
Jul 28, 1998
Sold by
Dube Marie Elaine
Bought by
Hicks Robert Eric
Home Financials for this Owner
Home Financials are based on the most recent Mortgage that was taken out on this home.
Original Mortgage
$251,250
Interest Rate
6.9%
Purchase Details
Closed on
Jul 17, 1998
Sold by
The Old Orchard Company
Bought by
Hicks Robert Eric
Home Financials for this Owner
Home Financials are based on the most recent Mortgage that was taken out on this home.
Original Mortgage
$251,250
Interest Rate
6.9%
Create a Home Valuation Report for This Property
The Home Valuation Report is an in-depth analysis detailing your home's value as well as a comparison with similar homes in the area
Home Values in the Area
Average Home Value in this Area
Purchase History
| Date | Buyer | Sale Price | Title Company |
|---|---|---|---|
| Hicks Living Trust | -- | None Listed On Document | |
| Hicks Robert E | -- | Commonwealth Land Title Co | |
| Archer Jerry J | -- | Old Republic Title Company | |
| Hicks Robert Eric | -- | Old Republic Title Company | |
| Hicks Robert Eric | $336,000 | Old Republic Title Company |
Source: Public Records
Mortgage History
| Date | Status | Borrower | Loan Amount |
|---|---|---|---|
| Previous Owner | Hicks Robert E | $425,000 | |
| Previous Owner | Hicks Robert Eric | $251,250 |
Source: Public Records
Tax History Compared to Growth
Tax History
| Year | Tax Paid | Tax Assessment Tax Assessment Total Assessment is a certain percentage of the fair market value that is determined by local assessors to be the total taxable value of land and additions on the property. | Land | Improvement |
|---|---|---|---|---|
| 2025 | $6,366 | $526,306 | $219,473 | $306,833 |
| 2024 | $6,366 | $515,987 | $215,170 | $300,817 |
| 2023 | $6,327 | $505,870 | $210,951 | $294,919 |
| 2022 | $6,222 | $495,952 | $206,815 | $289,137 |
| 2021 | $6,192 | $486,228 | $202,760 | $283,468 |
| 2020 | $6,123 | $481,243 | $200,681 | $280,562 |
| 2019 | $6,065 | $471,808 | $196,747 | $275,061 |
| 2018 | $5,663 | $462,558 | $192,890 | $269,668 |
| 2017 | $5,780 | $453,489 | $189,108 | $264,381 |
| 2016 | $5,660 | $444,598 | $185,400 | $259,198 |
| 2015 | $5,340 | $437,921 | $182,616 | $255,305 |
| 2014 | $5,305 | $429,343 | $179,039 | $250,304 |
Source: Public Records
Map
Nearby Homes
- 1482 Goshawk Ct
- 8940 Acorn Way
- 1796 Colony Way
- 9110 Tea Tree Way
- 1925 Mantelli Dr
- 1469 Eagles Nest Ln
- 9045 Tea Tree Way
- 8745 Wild Iris Dr
- 1810 Carob Ct
- 1920 Mantelli Dr
- 1620 Welburn Ave
- 9250 Mahogany Ct
- 9214 Orinda Way
- 8341 Winter Green Ct
- 2302 Hoya Ln
- 1501 Welburn Ave
- 1206 Sycamore Ct
- 8320 Chantrelle Ct
- 1080 Sunrise Dr
- 9360 Benbow Dr
- 9207 Twinberry Way
- 9180 Crest Hill Ct
- 9200 Crest Hill Ct
- 9211 Twinberry Way
- 1490 Finch Ln
- 9160 Crest Hill Ct
- 9221 Twinberry Way
- 1487 Finch Ln
- 9202 Crest Hill Ct
- 9175 Crest Hill Ct
- 9210 Rancho Hills Dr
- 1489 Goshawk Ct
- 9227 Twinberry Way
- 9140 Crest Hill Ct
- 9195 Crest Hill Ct
- 1477 Finch Ln
- 1470 Finch Ln
- 1486 Swallow Ln
- 1479 Goshawk Ct
- 1492 Goshawk Ct