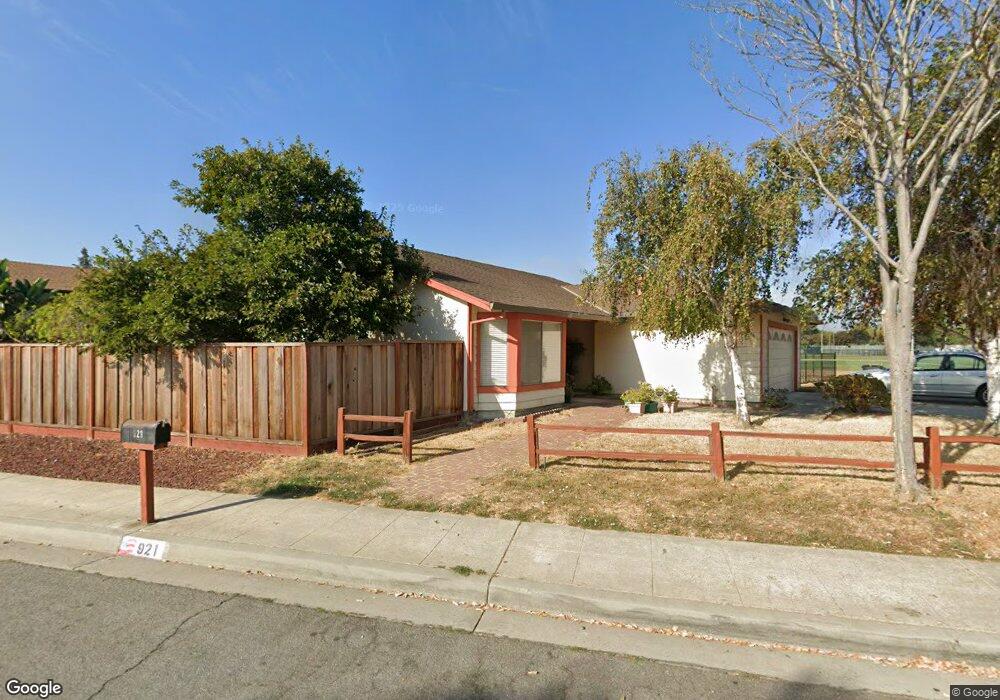
921 Coyote St Milpitas, CA 95035
Estimated Value: $1,599,949 - $1,736,000
3
Beds
2
Baths
1,553
Sq Ft
$1,079/Sq Ft
Est. Value
About This Home
This home is located at 921 Coyote St, Milpitas, CA 95035 and is currently estimated at $1,675,487, approximately $1,078 per square foot. 921 Coyote St is a home located in Santa Clara County with nearby schools including Curtner Elementary School, Thomas Russell Middle School, and Milpitas High School.
Ownership History
Date
Name
Owned For
Owner Type
Purchase Details
Closed on
Nov 20, 2002
Sold by
Ebalo Loida E and Ebalo Carmelita E
Bought by
Ebalo Loida E and Ebalo Carmelita E
Current Estimated Value
Home Financials for this Owner
Home Financials are based on the most recent Mortgage that was taken out on this home.
Original Mortgage
$170,000
Interest Rate
5.99%
Purchase Details
Closed on
Oct 28, 2002
Sold by
Ebalo Loida E and Ebalo Cesar E
Bought by
Ebalo Loida E and Ebalo Carmelita E
Home Financials for this Owner
Home Financials are based on the most recent Mortgage that was taken out on this home.
Original Mortgage
$170,000
Interest Rate
5.99%
Purchase Details
Closed on
Jan 3, 1994
Sold by
Edra Diosdado and Ebalo Loida E
Bought by
Ebalo Loida E and Ebalo Cesar E
Home Financials for this Owner
Home Financials are based on the most recent Mortgage that was taken out on this home.
Original Mortgage
$188,000
Interest Rate
7.38%
Create a Home Valuation Report for This Property
The Home Valuation Report is an in-depth analysis detailing your home's value as well as a comparison with similar homes in the area
Home Values in the Area
Average Home Value in this Area
Purchase History
| Date | Buyer | Sale Price | Title Company |
|---|---|---|---|
| Ebalo Loida E | -- | -- | |
| Ebalo Loida E | -- | Alliance Title Company | |
| Ebalo Loida E | -- | American Title Insurance Co |
Source: Public Records
Mortgage History
| Date | Status | Borrower | Loan Amount |
|---|---|---|---|
| Closed | Ebalo Loida E | $170,000 | |
| Closed | Ebalo Loida E | $188,000 |
Source: Public Records
Tax History
| Year | Tax Paid | Tax Assessment Tax Assessment Total Assessment is a certain percentage of the fair market value that is determined by local assessors to be the total taxable value of land and additions on the property. | Land | Improvement |
|---|---|---|---|---|
| 2025 | $6,509 | $563,980 | $234,998 | $328,982 |
| 2024 | $6,509 | $552,923 | $230,391 | $322,532 |
| 2023 | $6,487 | $542,082 | $225,874 | $316,208 |
| 2022 | $6,461 | $531,454 | $221,446 | $310,008 |
| 2021 | $6,366 | $521,034 | $217,104 | $303,930 |
| 2020 | $6,256 | $515,692 | $214,878 | $300,814 |
| 2019 | $6,185 | $505,581 | $210,665 | $294,916 |
| 2018 | $5,875 | $495,669 | $206,535 | $289,134 |
| 2017 | $5,799 | $485,951 | $202,486 | $283,465 |
| 2016 | $5,563 | $476,423 | $198,516 | $277,907 |
| 2015 | $5,505 | $469,268 | $195,535 | $273,733 |
| 2014 | $5,351 | $460,076 | $191,705 | $268,371 |
Source: Public Records
Map
Nearby Homes
- 207 Redwood Ave
- 1006 N Abbott Ave
- 1008 N Abbott Ave
- 513 Glenmoor Cir
- 527 Maple Ave
- 472 Glenmoor Cir
- 102 Marylinn Dr
- 170 Marylinn Dr
- 1200 N Abbott Ave Unit 200
- 1087 N Abbott Ave
- 7280 Marylinn Dr
- 60 Jacklin Place
- 1279 Milkweed St
- 0 Railroad Ave
- 175 Barker St
- 1357 California Cir
- 1363 Lilac Way
- 622 Chamise Way
- 1357 Lilac Way
- 1359 Lilac Way
Your Personal Tour Guide
Ask me questions while you tour the home.