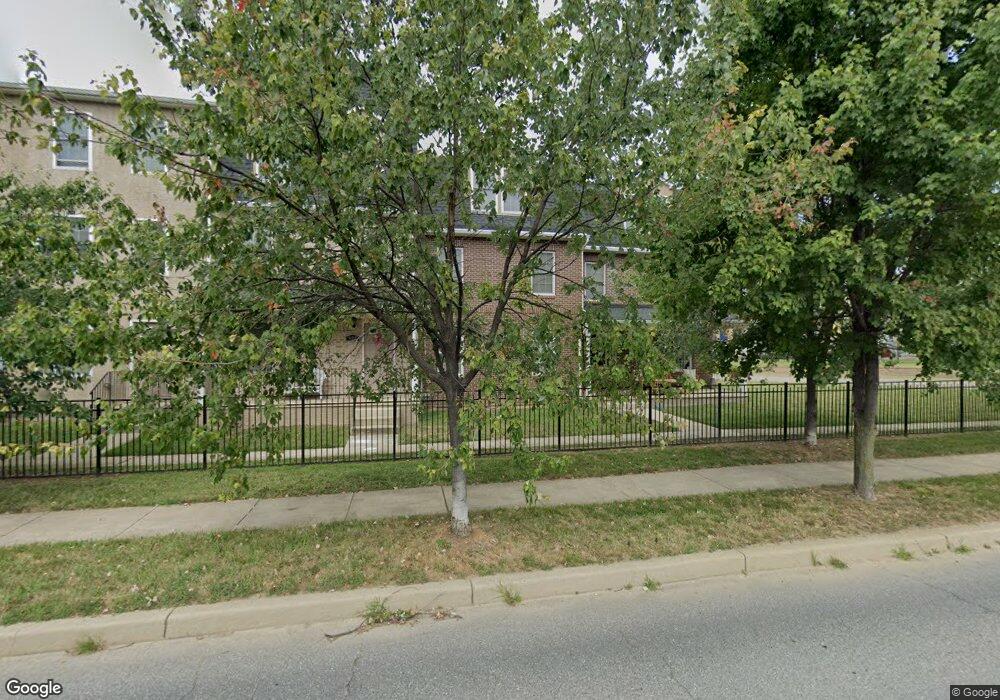
921 Duncan St Wilmington, DE 19805
Browntown NeighborhoodEstimated Value: $312,000 - $342,078
3
Beds
3
Baths
2,662
Sq Ft
$123/Sq Ft
Est. Value
About This Home
This home is located at 921 Duncan St, Wilmington, DE 19805 and is currently estimated at $327,270, approximately $122 per square foot. 921 Duncan St is a home located in New Castle County with nearby schools including The Bayard School, Glasgow High School, and St Elizabeth Elementary School.
Ownership History
Date
Name
Owned For
Owner Type
Purchase Details
Closed on
Feb 28, 2013
Sold by
Christina Overlook Llc
Bought by
Townsley Erin N
Current Estimated Value
Home Financials for this Owner
Home Financials are based on the most recent Mortgage that was taken out on this home.
Original Mortgage
$169,750
Outstanding Balance
$119,788
Interest Rate
3.54%
Mortgage Type
Future Advance Clause Open End Mortgage
Estimated Equity
$207,482
Purchase Details
Closed on
Apr 26, 2012
Sold by
Wilmington Housing Partnership Corporati
Bought by
Christina Overlook Llc
Home Financials for this Owner
Home Financials are based on the most recent Mortgage that was taken out on this home.
Original Mortgage
$460,000
Interest Rate
4.08%
Mortgage Type
Construction
Create a Home Valuation Report for This Property
The Home Valuation Report is an in-depth analysis detailing your home's value as well as a comparison with similar homes in the area
Home Values in the Area
Average Home Value in this Area
Purchase History
| Date | Buyer | Sale Price | Title Company |
|---|---|---|---|
| Townsley Erin N | $175,000 | None Available | |
| Christina Overlook Llc | -- | None Available |
Source: Public Records
Mortgage History
| Date | Status | Borrower | Loan Amount |
|---|---|---|---|
| Open | Townsley Erin N | $169,750 | |
| Previous Owner | Christina Overlook Llc | $460,000 |
Source: Public Records
Tax History Compared to Growth
Tax History
| Year | Tax Paid | Tax Assessment Tax Assessment Total Assessment is a certain percentage of the fair market value that is determined by local assessors to be the total taxable value of land and additions on the property. | Land | Improvement |
|---|---|---|---|---|
| 2024 | $2,241 | $60,800 | $4,300 | $56,500 |
| 2023 | $2,185 | $60,800 | $4,300 | $56,500 |
| 2022 | $2,163 | $60,800 | $4,300 | $56,500 |
| 2021 | $2,107 | $60,800 | $4,300 | $56,500 |
| 2020 | $2,046 | $60,800 | $4,300 | $56,500 |
| 2019 | $2,993 | $60,800 | $4,300 | $56,500 |
| 2018 | $1,748 | $60,800 | $4,300 | $56,500 |
| 2017 | $1,696 | $60,800 | $4,300 | $56,500 |
| 2016 | $1,691 | $60,800 | $4,300 | $56,500 |
| 2015 | $2,641 | $60,800 | $4,300 | $56,500 |
| 2014 | $2,640 | $60,800 | $4,300 | $56,500 |
Source: Public Records
Map
Nearby Homes