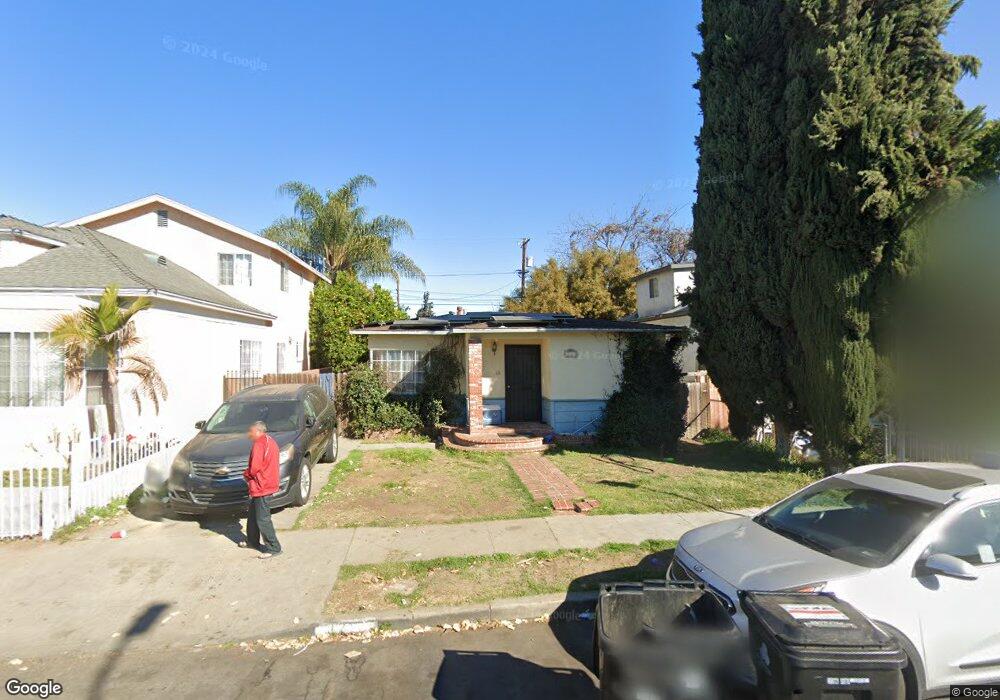
921 E 52nd St Los Angeles, CA 90011
South Park NeighborhoodEstimated Value: $546,720 - $633,000
3
Beds
2
Baths
1,008
Sq Ft
$594/Sq Ft
Est. Value
About This Home
This home is located at 921 E 52nd St, Los Angeles, CA 90011 and is currently estimated at $598,680, approximately $593 per square foot. 921 E 52nd St is a home located in Los Angeles County with nearby schools including Aurora Elementary School, Los Angeles Academy Middle School, and Thomas Jefferson Senior High School.
Ownership History
Date
Name
Owned For
Owner Type
Purchase Details
Closed on
Feb 16, 2007
Sold by
Smith Kenneth C
Bought by
Smith Kenneth C
Current Estimated Value
Purchase Details
Closed on
Nov 23, 2005
Sold by
Smith Kenneth C
Bought by
Smith Kenneth C
Home Financials for this Owner
Home Financials are based on the most recent Mortgage that was taken out on this home.
Original Mortgage
$228,000
Interest Rate
6.75%
Mortgage Type
Purchase Money Mortgage
Create a Home Valuation Report for This Property
The Home Valuation Report is an in-depth analysis detailing your home's value as well as a comparison with similar homes in the area
Home Values in the Area
Average Home Value in this Area
Purchase History
| Date | Buyer | Sale Price | Title Company |
|---|---|---|---|
| Smith Kenneth C | -- | Accommodation | |
| Smith Kenneth C | -- | Accommodation | |
| Smith Kenneth C | -- | Chicago Title Company | |
| Smith Kenneth C | -- | Chicago Title Company |
Source: Public Records
Mortgage History
| Date | Status | Borrower | Loan Amount |
|---|---|---|---|
| Closed | Smith Kenneth C | $228,000 |
Source: Public Records
Tax History
| Year | Tax Paid | Tax Assessment Tax Assessment Total Assessment is a certain percentage of the fair market value that is determined by local assessors to be the total taxable value of land and additions on the property. | Land | Improvement |
|---|---|---|---|---|
| 2025 | $809 | $55,043 | $13,933 | $41,110 |
| 2024 | $809 | $53,964 | $13,660 | $40,304 |
| 2023 | $796 | $52,907 | $13,393 | $39,514 |
| 2022 | $763 | $51,871 | $13,131 | $38,740 |
| 2021 | $748 | $50,855 | $12,874 | $37,981 |
| 2019 | $727 | $49,348 | $12,493 | $36,855 |
| 2018 | $665 | $48,382 | $12,249 | $36,133 |
| 2017 | $649 | $47,434 | $12,009 | $35,425 |
| 2016 | $622 | $46,505 | $11,774 | $34,731 |
| 2015 | $614 | $45,808 | $11,598 | $34,210 |
| 2014 | $624 | $44,911 | $11,371 | $33,540 |
Source: Public Records
Map
Nearby Homes
Your Personal Tour Guide
Ask me questions while you tour the home.