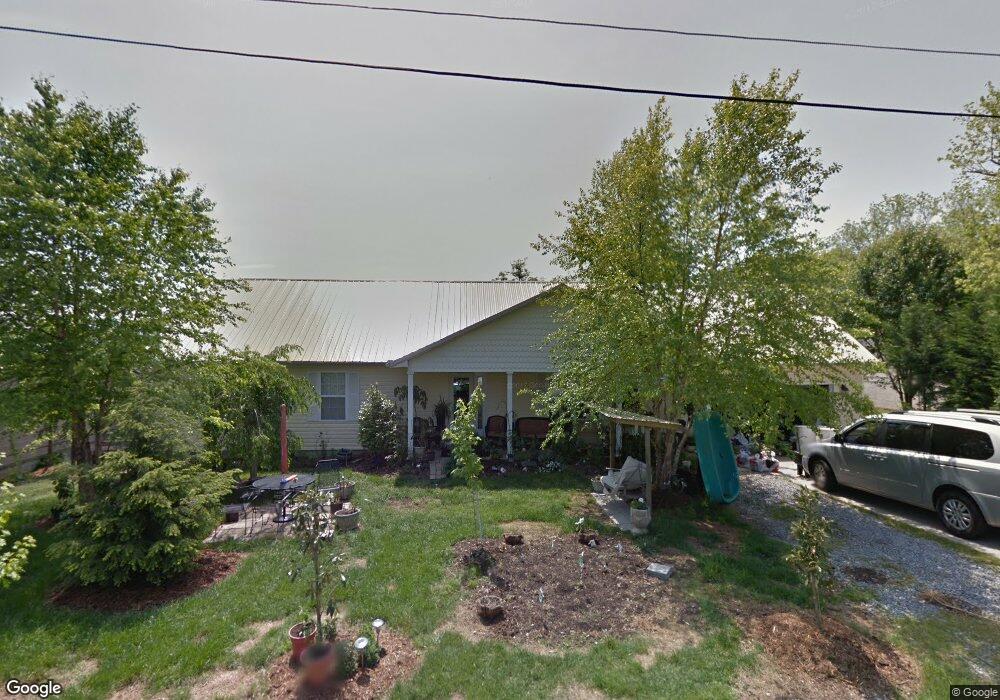
921 Houston Dr Seymour, TN 37865
Estimated Value: $299,000 - $340,000
--
Bed
2
Baths
1,596
Sq Ft
$202/Sq Ft
Est. Value
About This Home
This home is located at 921 Houston Dr, Seymour, TN 37865 and is currently estimated at $321,719, approximately $201 per square foot. 921 Houston Dr is a home located in Blount County with nearby schools including Prospect Elementary School, Heritage Middle School, and Heritage High School.
Ownership History
Date
Name
Owned For
Owner Type
Purchase Details
Closed on
Mar 15, 2017
Sold by
Clark Lonnie
Bought by
Hickman Tyrone and Hickman Jeanne M
Current Estimated Value
Purchase Details
Closed on
Aug 16, 2005
Sold by
Pena Jorge
Bought by
Clark Lonnie Clark Carol
Purchase Details
Closed on
Jun 1, 2005
Sold by
Ruby Reed L
Bought by
Pena Jorge
Purchase Details
Closed on
Oct 12, 1995
Sold by
Baker Robert Lee
Bought by
Flynn Robert E and Flynn Vickie M
Purchase Details
Closed on
Aug 21, 1995
Sold by
Hickman David and Hickman Judy A
Bought by
Rockwell Douglas W and Rockwell Mary
Purchase Details
Closed on
Jun 24, 1994
Sold by
Berries William
Bought by
Fox Candice
Purchase Details
Closed on
Mar 23, 1994
Sold by
Sec Of Housing & Urban Dev
Bought by
Bigger William
Purchase Details
Closed on
Nov 4, 1970
Bought by
Reed Henry and Ruby Lee
Create a Home Valuation Report for This Property
The Home Valuation Report is an in-depth analysis detailing your home's value as well as a comparison with similar homes in the area
Home Values in the Area
Average Home Value in this Area
Purchase History
| Date | Buyer | Sale Price | Title Company |
|---|---|---|---|
| Hickman Tyrone | $127,000 | -- | |
| Clark Lonnie Clark Carol | $132,000 | -- | |
| Pena Jorge | $16,000 | -- | |
| Flynn Robert E | $68,000 | -- | |
| Rockwell Douglas W | $72,900 | -- | |
| Fox Candice | -- | -- | |
| Bigger William | $62,000 | -- | |
| Reed Henry | -- | -- |
Source: Public Records
Tax History Compared to Growth
Tax History
| Year | Tax Paid | Tax Assessment Tax Assessment Total Assessment is a certain percentage of the fair market value that is determined by local assessors to be the total taxable value of land and additions on the property. | Land | Improvement |
|---|---|---|---|---|
| 2025 | $1,052 | $66,150 | $0 | $0 |
| 2024 | $1,052 | $66,150 | $10,000 | $56,150 |
| 2023 | $1,052 | $66,150 | $10,000 | $56,150 |
| 2022 | $884 | $35,775 | $6,250 | $29,525 |
| 2021 | $884 | $35,775 | $6,250 | $29,525 |
| 2020 | $884 | $35,775 | $6,250 | $29,525 |
| 2019 | $884 | $35,775 | $6,250 | $29,525 |
| 2018 | $845 | $34,200 | $4,750 | $29,450 |
| 2017 | $845 | $34,200 | $4,750 | $29,450 |
| 2016 | $845 | $34,200 | $4,750 | $29,450 |
| 2015 | $735 | $34,200 | $4,750 | $29,450 |
| 2014 | $802 | $34,200 | $4,750 | $29,450 |
| 2013 | $802 | $37,300 | $0 | $0 |
Source: Public Records
Map
Nearby Homes
- 5925 Sevierville Rd
- 830 Easey St
- 0 Miller Cir
- 715 Winston Dr
- 634 Crestview Ct
- 827 Hinkle Estates Dr
- 237 Westmoreland Ct
- 205 Blue Ridge Ln
- 862 Hinkle Estates Dr
- 521 Devon St
- 116 Blue Ridge Ln
- 516 Keck St
- 1137 Oakes Vista Ln
- 534 Tennessee Cir
- 516 Cherokee Hills Rd
- 1506 Cunningham Rd W
- 0 Burns Ln
- 6116 Nails Creek Rd
- 1419 Cheyenne Blvd
- 802 Hinkle Rd