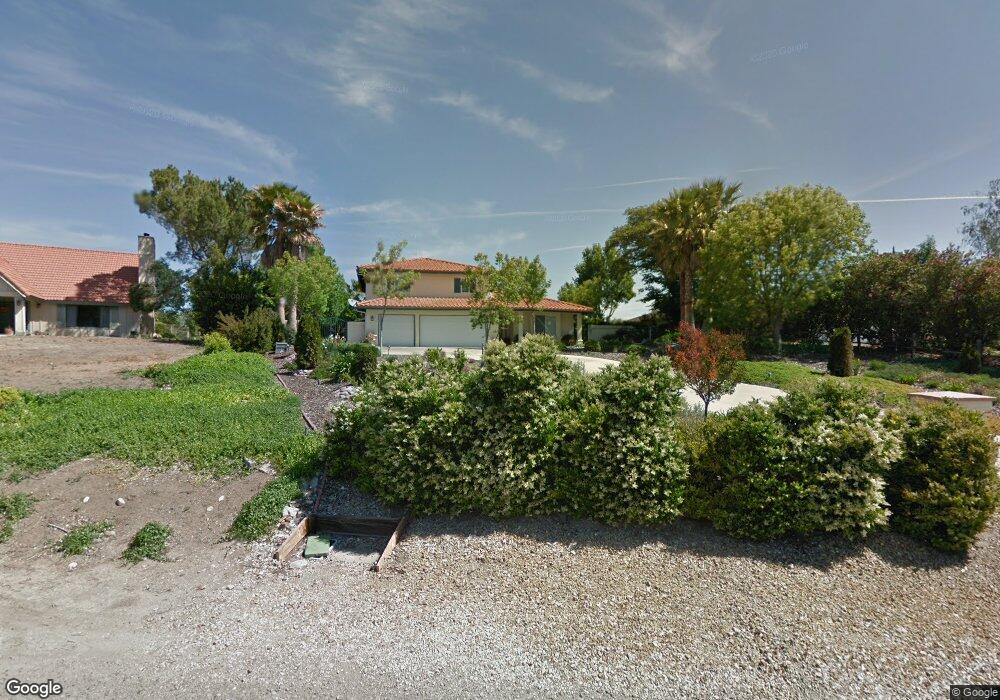
921 Osos Way Paso Robles, CA 93446
Estimated Value: $1,044,232 - $1,432,000
4
Beds
3
Baths
2,600
Sq Ft
$453/Sq Ft
Est. Value
About This Home
This home is located at 921 Osos Way, Paso Robles, CA 93446 and is currently estimated at $1,179,058, approximately $453 per square foot. 921 Osos Way is a home located in San Luis Obispo County with nearby schools including Kermit King Elementary School, Daniel Lewis Middle School, and Paso Robles High School.
Ownership History
Date
Name
Owned For
Owner Type
Purchase Details
Closed on
Feb 1, 2016
Sold by
Scott Stanley Gene and Scott Sharie Arlene
Bought by
Revocabl Alspach Martha L
Current Estimated Value
Purchase Details
Closed on
Sep 10, 1996
Sold by
Bernstein Melvin L
Bought by
Scott Stanley Gene and Scott Sharie Arlene
Home Financials for this Owner
Home Financials are based on the most recent Mortgage that was taken out on this home.
Original Mortgage
$204,000
Interest Rate
8.37%
Purchase Details
Closed on
Sep 1, 1994
Sold by
Ontiveros Joseph P and Ontiveros Suzanne
Bought by
Bernstein Melvin L and Ridino William J
Home Financials for this Owner
Home Financials are based on the most recent Mortgage that was taken out on this home.
Original Mortgage
$49,400
Interest Rate
8.7%
Create a Home Valuation Report for This Property
The Home Valuation Report is an in-depth analysis detailing your home's value as well as a comparison with similar homes in the area
Home Values in the Area
Average Home Value in this Area
Purchase History
| Date | Buyer | Sale Price | Title Company |
|---|---|---|---|
| Revocabl Alspach Martha L | $620,000 | First American Title Company | |
| Scott Stanley Gene | $255,000 | Fidelity National Title Co | |
| Bernstein Melvin L | $76,000 | Chicago Title Company |
Source: Public Records
Mortgage History
| Date | Status | Borrower | Loan Amount |
|---|---|---|---|
| Previous Owner | Scott Stanley Gene | $204,000 | |
| Previous Owner | Bernstein Melvin L | $49,400 | |
| Closed | Scott Stanley Gene | $20,000 |
Source: Public Records
Tax History Compared to Growth
Tax History
| Year | Tax Paid | Tax Assessment Tax Assessment Total Assessment is a certain percentage of the fair market value that is determined by local assessors to be the total taxable value of land and additions on the property. | Land | Improvement |
|---|---|---|---|---|
| 2025 | $8,000 | $733,948 | $272,269 | $461,679 |
| 2024 | $7,869 | $719,558 | $266,931 | $452,627 |
| 2023 | $7,869 | $705,450 | $261,698 | $443,752 |
| 2022 | $7,752 | $691,618 | $256,567 | $435,051 |
| 2021 | $7,620 | $678,058 | $251,537 | $426,521 |
| 2020 | $7,516 | $671,106 | $248,958 | $422,148 |
| 2019 | $7,410 | $657,948 | $244,077 | $413,871 |
| 2018 | $7,309 | $645,048 | $239,292 | $405,756 |
| 2017 | $6,873 | $632,400 | $234,600 | $397,800 |
| 2016 | $4,228 | $396,004 | $133,443 | $262,561 |
| 2015 | $4,211 | $390,057 | $131,439 | $258,618 |
| 2014 | $4,063 | $382,418 | $128,865 | $253,553 |
Source: Public Records
Map
Nearby Homes
- 925 Osos Way
- 833 Rolling Hills Rd Unit 16
- 1766 Union Rd
- 959 Vista Cerro Dr
- 430 Montebello Oaks Dr
- 1226 Kapareil Ln
- 0 Orchard Dr
- 912 Salida Del Sol Dr
- 2450 Golden Hill Rd
- 715 Orchard Dr
- 2050 Prospect Ave
- 726 N Trigo Ln
- 0 Ardmore Rd Unit NS24094144
- 0 Ardmore Rd Unit NS24094132
- 0 Ardmore Rd Unit NS24094137
- 0 Ardmore Rd Unit NS24094126
- 616 Jackson Dr
- 821 Marlbank Place
- 845 Creston Rd
- 533 Ferro Ln