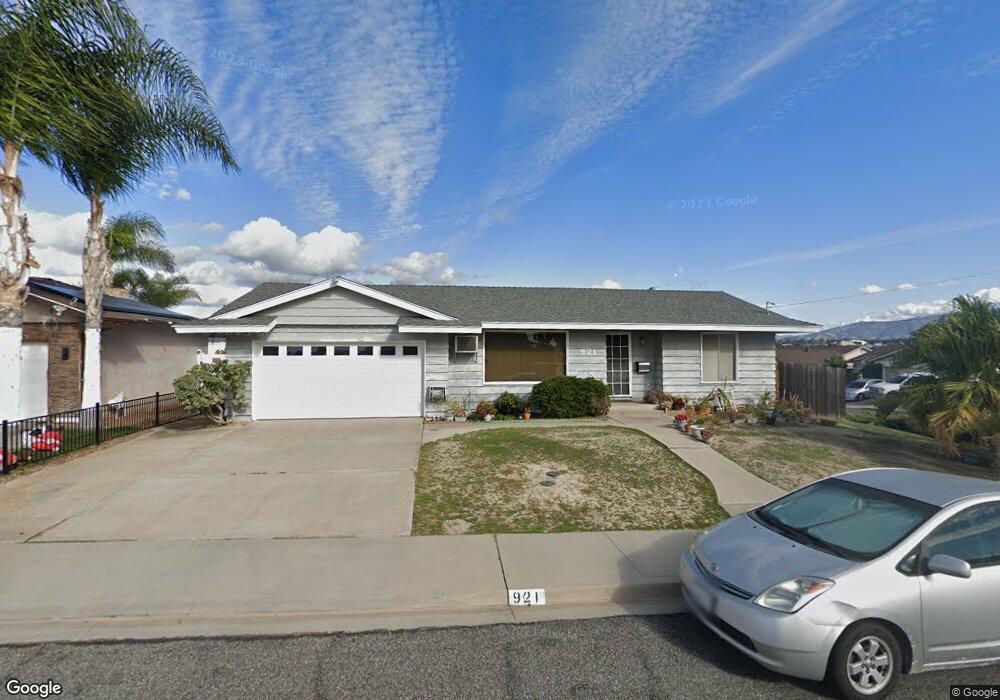
921 Scripps Ave Chula Vista, CA 91913
Eastlake NeighborhoodEstimated Value: $915,354 - $1,106,000
4
Beds
2
Baths
1,974
Sq Ft
$496/Sq Ft
Est. Value
About This Home
This home is located at 921 Scripps Ave, Chula Vista, CA 91913 and is currently estimated at $979,339, approximately $496 per square foot. 921 Scripps Ave is a home located in San Diego County with nearby schools including Burton C. Tiffany Elementary School, Bonita Vista Middle School, and Bonita Vista Senior High School.
Ownership History
Date
Name
Owned For
Owner Type
Purchase Details
Closed on
Dec 12, 2016
Sold by
Calderon Yee Evelyn
Bought by
Yee Donna
Current Estimated Value
Purchase Details
Closed on
Sep 14, 2015
Sold by
Yee Grace M
Bought by
Yee Cheong Yu
Purchase Details
Closed on
Oct 9, 1998
Sold by
Yee Cheong Y
Bought by
Yee Cheong Y and Yee Grace M
Purchase Details
Closed on
Nov 22, 1995
Sold by
Setterlund Thomas C and Setterlund Elizabeth C
Bought by
Yee Cheong Y and Yee Grace
Home Financials for this Owner
Home Financials are based on the most recent Mortgage that was taken out on this home.
Original Mortgage
$193,800
Interest Rate
7.18%
Mortgage Type
Assumption
Purchase Details
Closed on
Aug 4, 1993
Sold by
Ursillo Michael H and Ursillo Linda D
Bought by
Setterlund Thomas C and Setterlund Elizabeth C
Home Financials for this Owner
Home Financials are based on the most recent Mortgage that was taken out on this home.
Original Mortgage
$192,850
Interest Rate
7.16%
Create a Home Valuation Report for This Property
The Home Valuation Report is an in-depth analysis detailing your home's value as well as a comparison with similar homes in the area
Home Values in the Area
Average Home Value in this Area
Purchase History
| Date | Buyer | Sale Price | Title Company |
|---|---|---|---|
| Yee Donna | -- | None Available | |
| Yee Cheong Yu | -- | None Available | |
| Yee Cheong Y | -- | -- | |
| Yee Cheong Y | $190,000 | Fidelity National Title | |
| Setterlund Thomas C | $203,000 | Orange Coast Title Company |
Source: Public Records
Mortgage History
| Date | Status | Borrower | Loan Amount |
|---|---|---|---|
| Previous Owner | Yee Cheong Y | $193,800 | |
| Previous Owner | Setterlund Thomas C | $192,850 |
Source: Public Records
Tax History Compared to Growth
Tax History
| Year | Tax Paid | Tax Assessment Tax Assessment Total Assessment is a certain percentage of the fair market value that is determined by local assessors to be the total taxable value of land and additions on the property. | Land | Improvement |
|---|---|---|---|---|
| 2025 | $3,579 | $315,608 | $124,373 | $191,235 |
| 2024 | $3,579 | $309,421 | $121,935 | $187,486 |
| 2023 | $3,529 | $303,355 | $119,545 | $183,810 |
| 2022 | $3,426 | $297,407 | $117,201 | $180,206 |
| 2021 | $3,346 | $291,576 | $114,903 | $176,673 |
| 2020 | $3,266 | $288,587 | $113,725 | $174,862 |
| 2019 | $3,180 | $282,930 | $111,496 | $171,434 |
| 2018 | $3,130 | $277,383 | $109,310 | $168,073 |
| 2017 | $3,143 | $271,945 | $107,167 | $164,778 |
| 2016 | $2,990 | $266,614 | $105,066 | $161,548 |
| 2015 | $2,947 | $262,610 | $103,488 | $159,122 |
| 2014 | $2,897 | $257,467 | $101,461 | $156,006 |
Source: Public Records
Map
Nearby Homes
- 1761 Harvard St
- 1665 Yale St
- 1654 Yale St
- 1925 Otay Lakes Rd Unit 69
- 1925 Otay Lakes Rd Unit 43
- 1925 Otay Lakes Rd Unit 39
- 1925 Otay Lakes Rd Unit 167
- 1579 Apache Dr Unit E
- 1567 Apache Dr Unit A
- 1633 Quailsprings Ct
- 1626 Coolsprings Ct
- 1733 Mendota St
- 1532 Apache Dr Unit D
- 731 Baylor Ave
- 678 Rue Avallon
- 1153 Gustine St
- 2015 Lakeridge Cir Unit 301
- 1757 Via Capri
- 725 Brookstone Rd Unit 101
- 2083 Waterbury