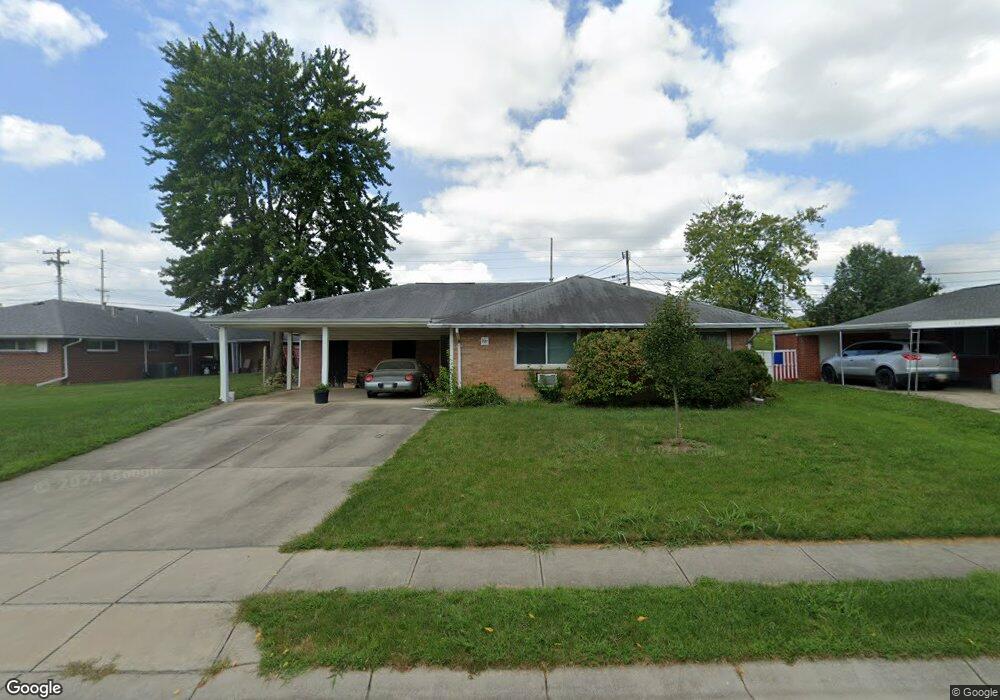
921 Sharon Dr Lebanon, OH 45036
Estimated Value: $229,883 - $253,000
4
Beds
2
Baths
1,560
Sq Ft
$153/Sq Ft
Est. Value
About This Home
This home is located at 921 Sharon Dr, Lebanon, OH 45036 and is currently estimated at $239,221, approximately $153 per square foot. 921 Sharon Dr is a home located in Warren County with nearby schools including Bowman Primary School, Berry Intermediate School, and Donovan Elementary School.
Ownership History
Date
Name
Owned For
Owner Type
Purchase Details
Closed on
Aug 17, 2001
Sold by
Royal Diana S
Bought by
Combs Timothy C
Current Estimated Value
Home Financials for this Owner
Home Financials are based on the most recent Mortgage that was taken out on this home.
Original Mortgage
$103,500
Outstanding Balance
$40,607
Interest Rate
7.23%
Mortgage Type
New Conventional
Estimated Equity
$198,614
Purchase Details
Closed on
Oct 29, 1998
Sold by
Runyon Roger M
Bought by
Royal Diana S
Home Financials for this Owner
Home Financials are based on the most recent Mortgage that was taken out on this home.
Original Mortgage
$88,000
Interest Rate
7%
Mortgage Type
New Conventional
Purchase Details
Closed on
Oct 6, 1983
Sold by
Edmon Edmon and Edmon Kenneth S
Bought by
Runyon Runyon and Runyon Roger M
Purchase Details
Closed on
Oct 3, 1983
Bought by
Edmon and Edmon Kenneth S
Create a Home Valuation Report for This Property
The Home Valuation Report is an in-depth analysis detailing your home's value as well as a comparison with similar homes in the area
Home Values in the Area
Average Home Value in this Area
Purchase History
| Date | Buyer | Sale Price | Title Company |
|---|---|---|---|
| Combs Timothy C | $115,000 | -- | |
| Royal Diana S | $110,000 | -- | |
| Runyon Runyon | $45,000 | -- | |
| Edmon | -- | -- |
Source: Public Records
Mortgage History
| Date | Status | Borrower | Loan Amount |
|---|---|---|---|
| Open | Combs Timothy C | $103,500 | |
| Previous Owner | Royal Diana S | $88,000 |
Source: Public Records
Tax History Compared to Growth
Tax History
| Year | Tax Paid | Tax Assessment Tax Assessment Total Assessment is a certain percentage of the fair market value that is determined by local assessors to be the total taxable value of land and additions on the property. | Land | Improvement |
|---|---|---|---|---|
| 2024 | $2,486 | $59,170 | $8,750 | $50,420 |
| 2023 | $2,601 | $55,650 | $10,762 | $44,887 |
| 2022 | $2,709 | $55,650 | $10,763 | $44,888 |
| 2021 | $2,560 | $55,650 | $10,763 | $44,888 |
| 2020 | $2,464 | $45,245 | $8,750 | $36,495 |
| 2019 | $2,475 | $45,245 | $8,750 | $36,495 |
| 2018 | $2,125 | $45,245 | $8,750 | $36,495 |
| 2017 | $1,993 | $38,077 | $7,480 | $30,597 |
| 2016 | $2,057 | $38,077 | $7,480 | $30,597 |
| 2015 | $2,071 | $38,077 | $7,480 | $30,597 |
| 2014 | $2,157 | $38,080 | $7,480 | $30,600 |
| 2013 | $2,079 | $44,530 | $8,750 | $35,780 |
Source: Public Records
Map
Nearby Homes
- 1 Dryhill Ct
- 911 Birchwood Dr
- 11 Roxie Ct
- 917 Kerns Dr
- 908 Hartz Dr
- 1443 N Broadway St
- 1112 Hubbell Ct
- 465 Creekside Dr
- 5 Acres Lot D Phillips Rd
- 409 Bethpage Way Unit 7-301
- 5 Acres Ave
- 409 Bethpage Way
- 1033 Country Creek Dr
- 364 Grey's Run
- 351 Grey's Run
- 376 Grey's Run
- 19 Hathaway Commons
- 531 Quail Ct
- 532 French Run Ct
- 520 N Broadway St
- 923 Sharon Dr
- 930 Meadow Ln
- 0 Meadow Ln Unit 25 1681842
- 0 Meadow Ln Unit 16 1681833
- 0 Meadow Ln Unit 13
- 920 N Broadway St
- 925 Sharon Dr
- 922 N Broadway St
- 932 Meadow Ln
- 928 Meadow Ln
- 922 Sharon Dr
- 924 N Broadway St
- 920 Sharon Dr
- 927 Sharon Dr
- 931 Meadow Ln
- 924 Sharon Dr
- 2 Meadow Ln
- 2335 Ohio 48
- 2206 Ohio 48 Unit Lot B
- 5945 Ohio 48