Estimated Value: $496,000 - $516,000
3
Beds
2
Baths
1,575
Sq Ft
$321/Sq Ft
Est. Value
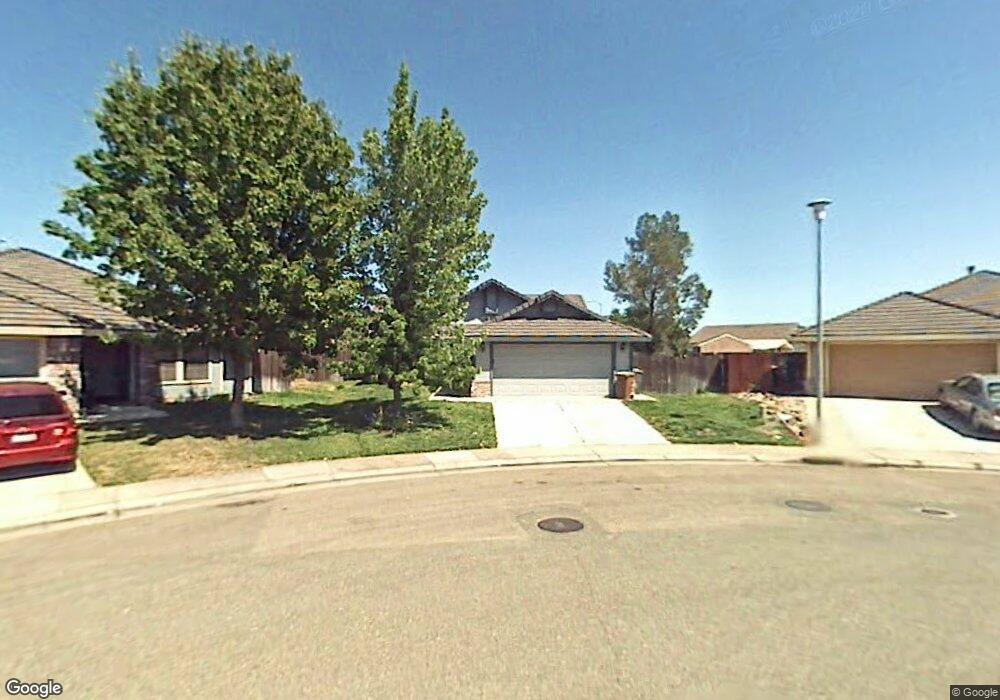
About This Home
This home is located at 922 Cedar Canyon Cir, Galt, CA 95632 and is currently estimated at $505,286, approximately $320 per square foot. 922 Cedar Canyon Cir is a home located in Sacramento County with nearby schools including Lake Canyon Elementary School, Robert L. McCaffrey Middle School, and Liberty Ranch High School.
Ownership History
Date
Name
Owned For
Owner Type
Purchase Details
Closed on
Jul 4, 2022
Sold by
Lee Willams Gordon
Bought by
Gordon Lee Williams 2022 Revocable Trust
Current Estimated Value
Purchase Details
Closed on
Nov 6, 2008
Sold by
Press Alfred and Press Donna
Bought by
Williams Gordon Lee
Home Financials for this Owner
Home Financials are based on the most recent Mortgage that was taken out on this home.
Original Mortgage
$202,718
Interest Rate
6.09%
Mortgage Type
FHA
Purchase Details
Closed on
Dec 5, 2003
Sold by
Perry Michael Eugene and Perry Heather Lynn
Bought by
Press Alfred and Press Donna
Home Financials for this Owner
Home Financials are based on the most recent Mortgage that was taken out on this home.
Original Mortgage
$216,000
Interest Rate
3.62%
Mortgage Type
Credit Line Revolving
Create a Home Valuation Report for This Property
The Home Valuation Report is an in-depth analysis detailing your home's value as well as a comparison with similar homes in the area
Home Values in the Area
Average Home Value in this Area
Purchase History
| Date | Buyer | Sale Price | Title Company |
|---|---|---|---|
| Gordon Lee Williams 2022 Revocable Trust | -- | None Listed On Document | |
| Williams Gordon Lee | $206,000 | Old Republic Title Company | |
| Press Alfred | $270,000 | Chicago Title Co |
Source: Public Records
Mortgage History
| Date | Status | Borrower | Loan Amount |
|---|---|---|---|
| Previous Owner | Williams Gordon Lee | $202,718 | |
| Previous Owner | Press Alfred | $216,000 | |
| Closed | Press Alfred | $54,000 |
Source: Public Records
Tax History Compared to Growth
Tax History
| Year | Tax Paid | Tax Assessment Tax Assessment Total Assessment is a certain percentage of the fair market value that is determined by local assessors to be the total taxable value of land and additions on the property. | Land | Improvement |
|---|---|---|---|---|
| 2025 | $3,016 | $265,133 | $96,574 | $168,559 |
| 2024 | $3,016 | $259,935 | $94,681 | $165,254 |
| 2023 | $2,967 | $254,839 | $92,825 | $162,014 |
| 2022 | $3,215 | $249,843 | $91,005 | $158,838 |
| 2021 | $3,218 | $244,945 | $89,221 | $155,724 |
| 2020 | $3,195 | $242,435 | $88,307 | $154,128 |
| 2019 | $3,127 | $237,682 | $86,576 | $151,106 |
| 2018 | $3,123 | $233,023 | $84,879 | $148,144 |
| 2017 | $3,019 | $228,455 | $83,215 | $145,240 |
| 2016 | $2,935 | $223,977 | $81,584 | $142,393 |
| 2015 | $3,076 | $220,614 | $80,359 | $140,255 |
| 2014 | $3,079 | $216,293 | $78,785 | $137,508 |
Source: Public Records
Map
Nearby Homes
- 908 Wildbrook Ct
- 1054 Starbrook Dr
- 866 Golden Heights Dr
- 953 Posey St
- 973 Posey St
- 968 Posey St
- 1026 Breakers Dr
- 843 Lake Park Cir
- 829 Lake Park Cir
- 825 Lake Park Cir
- 821 Lake Park Cir
- 803 Lake Park Cir
- 801 Lake Park Cir
- 799 Lake Park Cir
- 1145 Bellawood Dr
- 1107 Bellawood Dr
- Residence 1883 Plan at The Cottages at Greenwood
- 1103 Bellawood Dr
- Residence 2072 Plan at The Towns at Greenwood
- Residence 1894 Plan at The Towns at Greenwood
- 918 Cedar Canyon Cir
- 986 Cedar Canyon Cir
- 994 Cedar Canyon Cir
- 914 Cedar Canyon Cir
- 999 Padbury Ct
- 1002 Cedar Canyon Cir
- 993 Padbury Ct
- 907 Gerling Ct
- 993 Cedar Canyon Cir
- 1000 Padbury Ct
- 906 Cedar Canyon Cir
- 908 Gerling Ct
- 1010 Cedar Canyon Cir
- 987 Padbury Ct
- 1001 Cedar Canyon Cir
- 994 Padbury Ct
- 902 Cedar Canyon Cir
- 1018 Cedar Canyon Cir
- 911 Gerling Ct
- 988 Padbury Ct