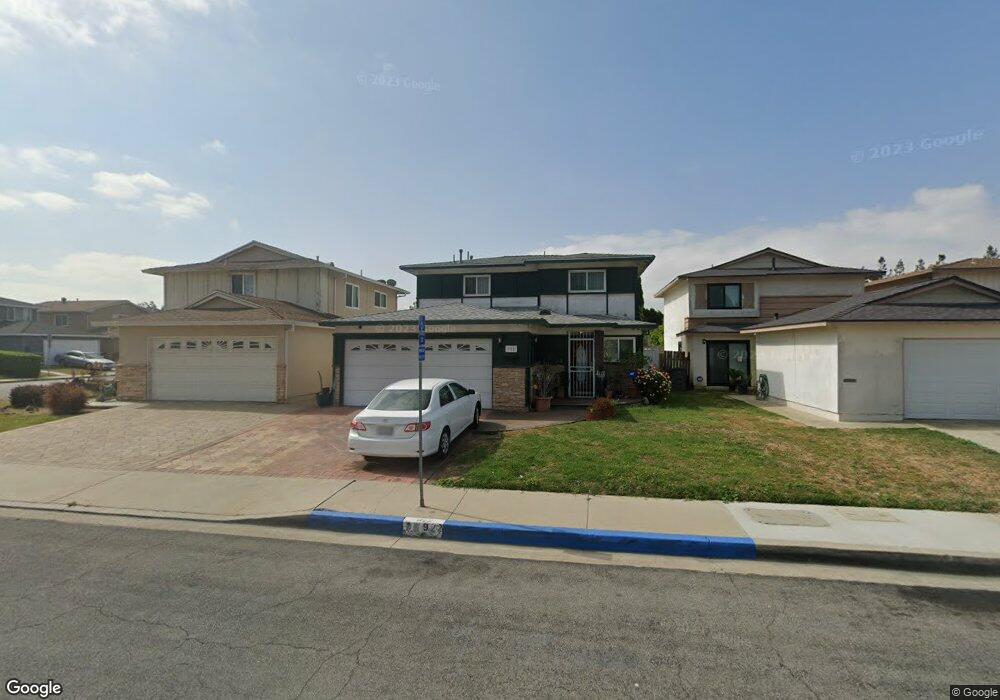
922 E Meadbrook St Carson, CA 90746
Estimated Value: $707,124 - $827,000
3
Beds
2
Baths
1,422
Sq Ft
$536/Sq Ft
Est. Value
About This Home
This home is located at 922 E Meadbrook St, Carson, CA 90746 and is currently estimated at $761,781, approximately $535 per square foot. 922 E Meadbrook St is a home located in Los Angeles County with nearby schools including Ralph Bunche Elementary School, Walton Middle School, and Compton High School.
Ownership History
Date
Name
Owned For
Owner Type
Purchase Details
Closed on
Jul 29, 2024
Sold by
Lumpkin Lois
Bought by
Lois Lumpkin Family Trust and Lumpkin
Current Estimated Value
Purchase Details
Closed on
Jul 15, 2003
Sold by
Lumpkin Lois
Bought by
Lumpkin Lois
Home Financials for this Owner
Home Financials are based on the most recent Mortgage that was taken out on this home.
Original Mortgage
$185,500
Interest Rate
5.87%
Mortgage Type
Purchase Money Mortgage
Purchase Details
Closed on
Jan 4, 2002
Sold by
Lumpkin Carl
Bought by
Lumpkin Lois
Home Financials for this Owner
Home Financials are based on the most recent Mortgage that was taken out on this home.
Original Mortgage
$176,750
Interest Rate
6.84%
Purchase Details
Closed on
Mar 2, 2001
Sold by
Lumpkin Lois
Bought by
Lumpkin Carl and Ware Carla
Create a Home Valuation Report for This Property
The Home Valuation Report is an in-depth analysis detailing your home's value as well as a comparison with similar homes in the area
Home Values in the Area
Average Home Value in this Area
Purchase History
| Date | Buyer | Sale Price | Title Company |
|---|---|---|---|
| Lois Lumpkin Family Trust | -- | None Listed On Document | |
| Lumpkin Lois | -- | Fidelity | |
| Lumpkin Lois | -- | Orange Coast Title | |
| Lumpkin Carl | -- | -- |
Source: Public Records
Mortgage History
| Date | Status | Borrower | Loan Amount |
|---|---|---|---|
| Previous Owner | Lumpkin Lois | $185,500 | |
| Previous Owner | Lumpkin Lois | $176,750 |
Source: Public Records
Tax History
| Year | Tax Paid | Tax Assessment Tax Assessment Total Assessment is a certain percentage of the fair market value that is determined by local assessors to be the total taxable value of land and additions on the property. | Land | Improvement |
|---|---|---|---|---|
| 2025 | $1,466 | $55,573 | $15,651 | $39,922 |
| 2024 | $1,466 | $54,485 | $15,345 | $39,140 |
| 2023 | $1,431 | $53,418 | $15,045 | $38,373 |
| 2022 | $1,354 | $52,371 | $14,750 | $37,621 |
| 2021 | $1,336 | $51,345 | $14,461 | $36,884 |
| 2019 | $3,005 | $49,824 | $14,033 | $35,791 |
| 2018 | $2,949 | $48,848 | $13,758 | $35,090 |
| 2016 | $2,884 | $46,953 | $13,225 | $33,728 |
| 2015 | $1,096 | $46,249 | $13,027 | $33,222 |
| 2014 | $964 | $45,344 | $12,772 | $32,572 |
Source: Public Records
Map
Nearby Homes
- 910 E Meadbrook St
- 17815 Lysander Dr
- 900 E Sagebank St
- 966 Apricot Way
- 17536 Yellowwood Way
- 17700 Avalon Blvd Unit 387
- 17700 S Avalon Blvd Unit 156
- 17701 S Avalon Blvd Unit 81
- 17923 Goodyear
- 17914 Goodyear
- 18325 Mettler Ave
- 17202 Ambler Ave
- 16952 Roa Dr
- 514 E Moorehaven Dr
- 17701 Avalon Blvd
- 17701 Avalon Blvd Unit 97
- 17701 Avalon Blvd Unit 400
- 19202 Campaign Dr
- 19221 Scobey Ave
- 19203 Galway Ave
- 918 E Meadbrook St
- 926 E Meadbrook St
- 914 E Meadbrook St
- 17811 Tamcliff Ave
- 17800 Lysander Dr
- 17817 Tamcliff Ave
- 17806 Lysander Dr
- 906 E Meadbrook St
- 921 E Meadbrook St
- 925 E Meadbrook St
- 919 E Meadbrook St
- 17819 Tamcliff Ave
- 929 E Meadbrook St
- 915 E Meadbrook St
- 17804 Tamcliff Ave
- 17810 Lysander Dr
- 17808 Tamcliff Ave
- 17800 Tamcliff Ave
- 17812 Tamcliff Ave
- 933 E Meadbrook St
Your Personal Tour Guide
Ask me questions while you tour the home.