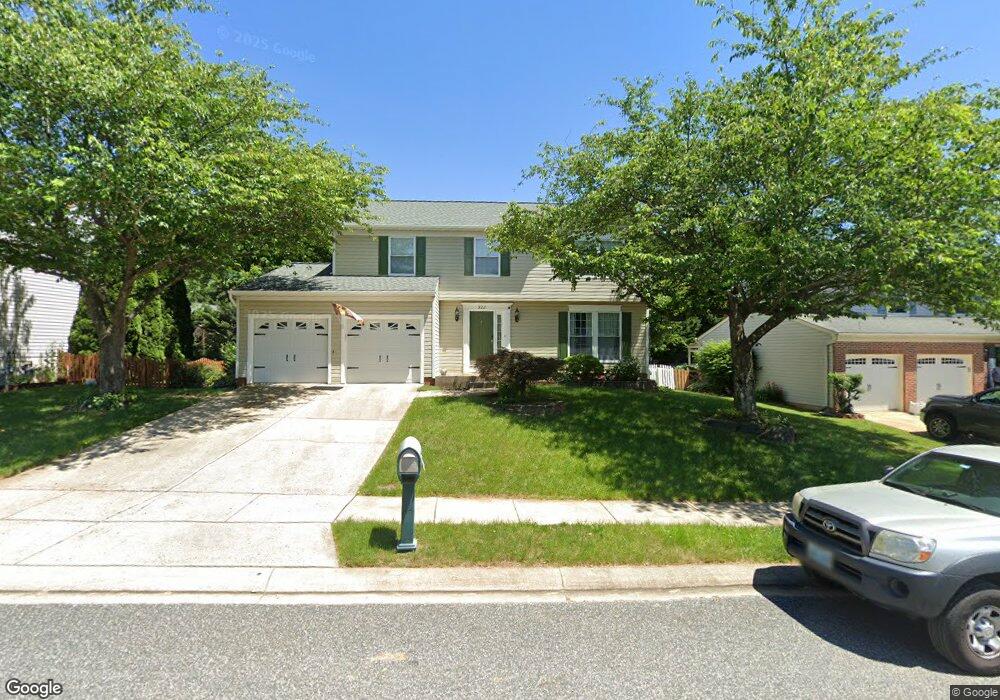
922 Hepburn Ln Bel Air, MD 21014
Estimated Value: $508,820 - $591,000
4
Beds
3
Baths
1,852
Sq Ft
$304/Sq Ft
Est. Value
About This Home
This home is located at 922 Hepburn Ln, Bel Air, MD 21014 and is currently estimated at $562,205, approximately $303 per square foot. 922 Hepburn Ln is a home located in Harford County with nearby schools including Red Pump Elementary School, Fallston Middle School, and Fallston High School.
Ownership History
Date
Name
Owned For
Owner Type
Purchase Details
Closed on
Oct 8, 2010
Sold by
Downey Michael W
Bought by
White Charles E and White Briana
Current Estimated Value
Home Financials for this Owner
Home Financials are based on the most recent Mortgage that was taken out on this home.
Original Mortgage
$359,450
Outstanding Balance
$238,283
Interest Rate
4.44%
Mortgage Type
VA
Estimated Equity
$323,922
Purchase Details
Closed on
Jun 2, 1992
Sold by
Ryan Operations G P
Bought by
Downey Michael W
Home Financials for this Owner
Home Financials are based on the most recent Mortgage that was taken out on this home.
Original Mortgage
$125,600
Interest Rate
8.6%
Purchase Details
Closed on
Mar 10, 1992
Sold by
Brentwood Park
Bought by
Ryan Operations G P
Home Financials for this Owner
Home Financials are based on the most recent Mortgage that was taken out on this home.
Original Mortgage
$144,600
Interest Rate
8.85%
Create a Home Valuation Report for This Property
The Home Valuation Report is an in-depth analysis detailing your home's value as well as a comparison with similar homes in the area
Home Values in the Area
Average Home Value in this Area
Purchase History
| Date | Buyer | Sale Price | Title Company |
|---|---|---|---|
| White Charles E | $348,000 | -- | |
| Downey Michael W | $143,500 | -- | |
| Ryan Operations G P | $45,500 | -- |
Source: Public Records
Mortgage History
| Date | Status | Borrower | Loan Amount |
|---|---|---|---|
| Open | White Charles E | $359,450 | |
| Previous Owner | Downey Michael W | $125,600 | |
| Previous Owner | Ryan Operations G P | $144,600 |
Source: Public Records
Tax History Compared to Growth
Tax History
| Year | Tax Paid | Tax Assessment Tax Assessment Total Assessment is a certain percentage of the fair market value that is determined by local assessors to be the total taxable value of land and additions on the property. | Land | Improvement |
|---|---|---|---|---|
| 2025 | $3,959 | $387,000 | $110,700 | $276,300 |
| 2024 | $3,959 | $367,667 | $0 | $0 |
| 2023 | $3,768 | $348,333 | $0 | $0 |
| 2022 | $3,586 | $329,000 | $110,700 | $218,300 |
| 2021 | $3,640 | $322,233 | $0 | $0 |
| 2020 | $3,640 | $315,467 | $0 | $0 |
| 2019 | $3,562 | $308,700 | $126,800 | $181,900 |
| 2018 | $3,476 | $303,967 | $0 | $0 |
| 2017 | $3,422 | $308,700 | $0 | $0 |
| 2016 | $140 | $294,500 | $0 | $0 |
| 2015 | $3,324 | $289,133 | $0 | $0 |
| 2014 | $3,324 | $283,767 | $0 | $0 |
Source: Public Records
Map
Nearby Homes
- 904 Martell Ct Unit E
- 1004 Downing Ct Unit 16
- 809 Peppard Dr
- 903 Garland Ct
- 817 Peppard Dr
- 827 Van Dyke Ln
- 711 Eastwood Ct
- 1316 Ipswich Dr
- 1322 Locust Ave
- 1203 N Tollgate Rd
- 222 Steed Ln
- 1346 Vanderbilt Rd
- 119 Stoneleigh Rd
- 1516 Cedarwood Dr
- 1353 Sweetbriar Ln
- 752 Roland Ave
- 747 Roland Ave
- 636 Wallingford Rd Unit 2C
- 636 Wallingford Rd Unit 2H
- 636 Wallingford Rd Unit 3G