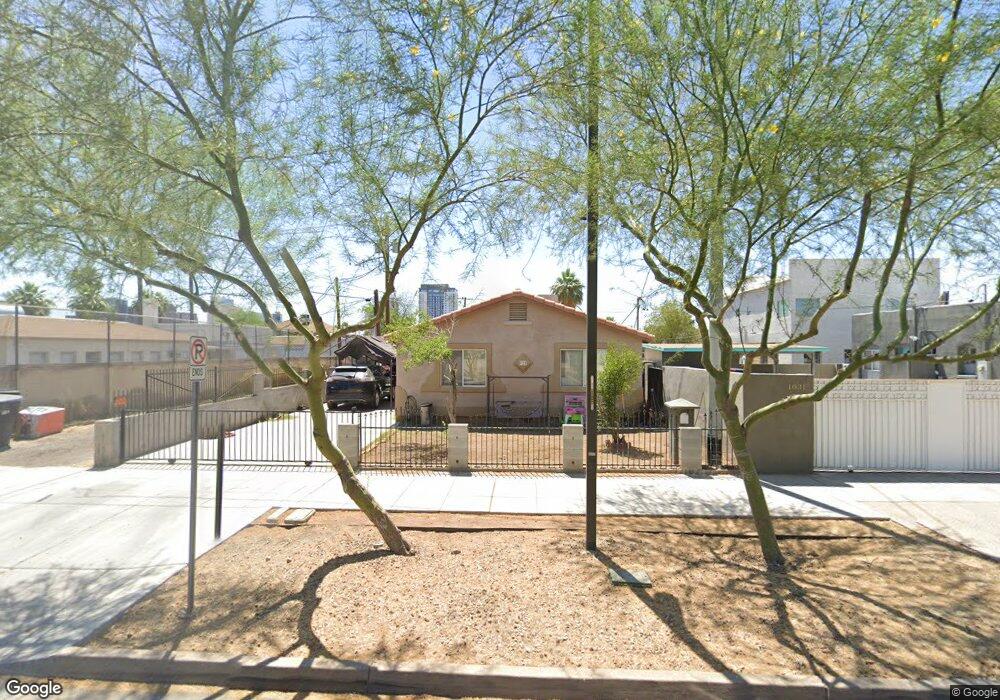
922 N 11th St Phoenix, AZ 85006
Garfield NeighborhoodEstimated Value: $339,994 - $400,000
--
Bed
1
Bath
1,040
Sq Ft
$362/Sq Ft
Est. Value
About This Home
This home is located at 922 N 11th St, Phoenix, AZ 85006 and is currently estimated at $376,499, approximately $362 per square foot. 922 N 11th St is a home located in Maricopa County with nearby schools including Garfield School, North High School, and Phoenix Coding Academy.
Ownership History
Date
Name
Owned For
Owner Type
Purchase Details
Closed on
Mar 24, 2013
Sold by
Ituarte Lucio Gonzalez and Munoz Manuela Barba
Bought by
Munoz Manuela Barba
Current Estimated Value
Purchase Details
Closed on
Nov 3, 2004
Sold by
Barba Manuela
Bought by
Gonzalez Lucio
Home Financials for this Owner
Home Financials are based on the most recent Mortgage that was taken out on this home.
Original Mortgage
$89,600
Outstanding Balance
$46,401
Interest Rate
6.35%
Mortgage Type
New Conventional
Estimated Equity
$330,098
Purchase Details
Closed on
Jul 30, 2001
Sold by
Cornerstone Business Systems Inc
Bought by
Gonzales Lucio and Barba Manuela
Home Financials for this Owner
Home Financials are based on the most recent Mortgage that was taken out on this home.
Original Mortgage
$10,500
Interest Rate
7.09%
Mortgage Type
Seller Take Back
Purchase Details
Closed on
May 9, 2001
Sold by
Nickele Investments and Sembach Pat
Bought by
Corners Business Systems Inc
Create a Home Valuation Report for This Property
The Home Valuation Report is an in-depth analysis detailing your home's value as well as a comparison with similar homes in the area
Home Values in the Area
Average Home Value in this Area
Purchase History
| Date | Buyer | Sale Price | Title Company |
|---|---|---|---|
| Munoz Manuela Barba | -- | None Available | |
| Gonzalez Lucio | -- | Security Title Agency | |
| Gonzales Lucio | $12,000 | Security Title Agency | |
| Corners Business Systems Inc | -- | -- |
Source: Public Records
Mortgage History
| Date | Status | Borrower | Loan Amount |
|---|---|---|---|
| Open | Gonzalez Lucio | $89,600 | |
| Previous Owner | Gonzales Lucio | $10,500 |
Source: Public Records
Tax History Compared to Growth
Tax History
| Year | Tax Paid | Tax Assessment Tax Assessment Total Assessment is a certain percentage of the fair market value that is determined by local assessors to be the total taxable value of land and additions on the property. | Land | Improvement |
|---|---|---|---|---|
| 2025 | $918 | $7,256 | -- | -- |
| 2024 | $852 | $6,911 | -- | -- |
| 2023 | $852 | $27,310 | $5,460 | $21,850 |
| 2022 | $819 | $21,400 | $4,280 | $17,120 |
| 2021 | $820 | $18,150 | $3,630 | $14,520 |
| 2020 | $832 | $17,810 | $3,560 | $14,250 |
| 2019 | $832 | $14,370 | $2,870 | $11,500 |
| 2018 | $817 | $12,460 | $2,490 | $9,970 |
| 2017 | $788 | $9,430 | $1,880 | $7,550 |
| 2016 | $766 | $7,830 | $1,560 | $6,270 |
| 2015 | $698 | $6,610 | $1,320 | $5,290 |
Source: Public Records
Map
Nearby Homes
- 1118 E Garfield St
- 1034 E Mckinley St
- 1029 E Mckinley St
- 1022 N 10th St
- 1145 E Portland St
- 1110 E Pierce St
- 1210 E Garfield St
- 1202 E Mckinley St
- 926 E Fillmore St
- 918 E Fillmore St Unit 5
- 1224 E Portland St
- 902 N 8th St Unit 15
- 727 E Portland St Unit 3
- 727 E Portland St Unit 6
- 510 N 10th St
- 907 E Fillmore St
- 502 N 11th St
- 901 E Fillmore St
- 1211 E Fillmore St
- 1302 E Pierce St
- 1029 E Roosevelt St
- 1029 E Roosevelt St Unit 200
- 1029 E Roosevelt St Unit 101
- 1029 E Roosevelt St Unit 100
- 1031 E Roosevelt St
- 1025 E Roosevelt St Unit 15
- 1025 E Roosevelt St
- 1021 E Roosevelt St
- 1101 E Roosevelt St
- 1101 E Roosevelt St Unit 1
- 1101 E Roosevelt St Unit 3
- 1101 E Roosevelt St Unit 2
- 1017 E Roosevelt St
- 1105 E Roosevelt St
- 1102 E Garfield St
- 1034 E Roosevelt St
- 1013 E Roosevelt St
- 1109 E Roosevelt St
- 1001 N 11th St
- 1110 E Garfield St