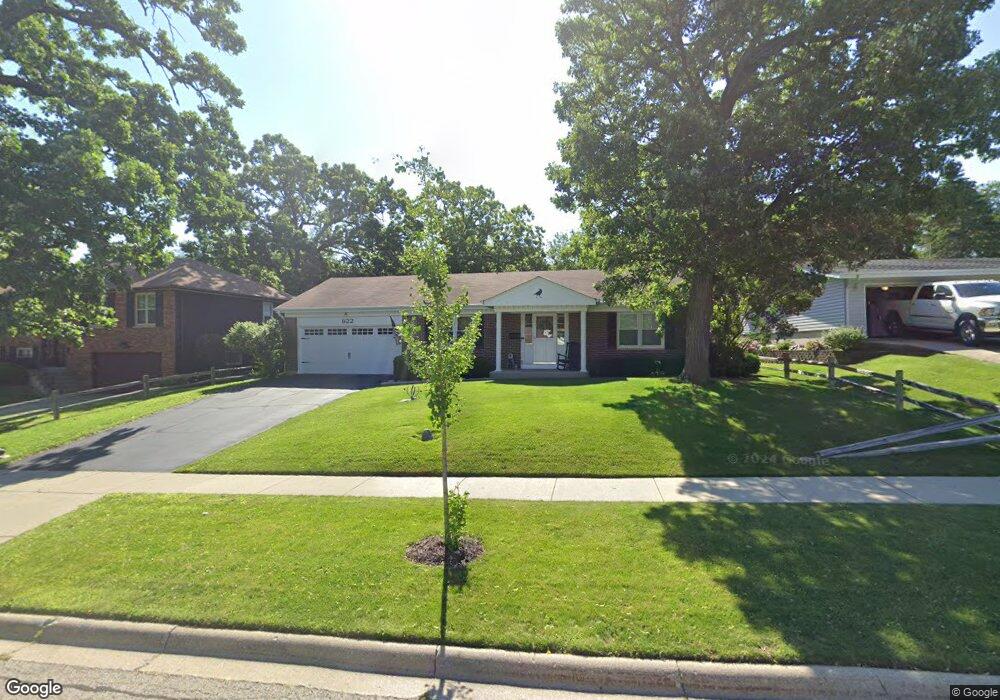
922 Royal Dr McHenry, IL 60050
Estimated Value: $284,000 - $317,000
3
Beds
2
Baths
1,459
Sq Ft
$206/Sq Ft
Est. Value
About This Home
This home is located at 922 Royal Dr, McHenry, IL 60050 and is currently estimated at $300,876, approximately $206 per square foot. 922 Royal Dr is a home located in McHenry County with nearby schools including Riverwood Elementary School, Parkland School, and Montini Catholic School.
Ownership History
Date
Name
Owned For
Owner Type
Purchase Details
Closed on
Jan 28, 2011
Sold by
Fink Dan J
Bought by
Sherman Brian and Sherman Melissa
Current Estimated Value
Home Financials for this Owner
Home Financials are based on the most recent Mortgage that was taken out on this home.
Original Mortgage
$114,160
Outstanding Balance
$78,339
Interest Rate
4.84%
Mortgage Type
New Conventional
Estimated Equity
$222,537
Purchase Details
Closed on
Sep 23, 2005
Sold by
Sorensen Marlene E
Bought by
Sorensen Marlene E and Marlene E Sorensen Declaration Of Trust
Purchase Details
Closed on
Sep 23, 2004
Sold by
Sorensen Marlene E
Bought by
Sorensen Marlene E and Marlene E Sorensen Declaration Of Trust
Purchase Details
Closed on
Jul 9, 2004
Sold by
Burger Lloyd P and Burger Marian E
Bought by
Sorensen Marlene E
Create a Home Valuation Report for This Property
The Home Valuation Report is an in-depth analysis detailing your home's value as well as a comparison with similar homes in the area
Home Values in the Area
Average Home Value in this Area
Purchase History
| Date | Buyer | Sale Price | Title Company |
|---|---|---|---|
| Sherman Brian | $142,700 | Fidelity National Title | |
| Sorensen Marlene E | -- | Ticor Title Insurance Compan | |
| Sorensen Marlene E | -- | -- | |
| Sorensen Marlene E | $175,500 | Ticor |
Source: Public Records
Mortgage History
| Date | Status | Borrower | Loan Amount |
|---|---|---|---|
| Open | Sherman Brian | $114,160 |
Source: Public Records
Tax History
| Year | Tax Paid | Tax Assessment Tax Assessment Total Assessment is a certain percentage of the fair market value that is determined by local assessors to be the total taxable value of land and additions on the property. | Land | Improvement |
|---|---|---|---|---|
| 2024 | $5,620 | $74,431 | $13,015 | $61,416 |
| 2023 | $5,421 | $66,682 | $11,660 | $55,022 |
| 2022 | $5,307 | $61,863 | $10,817 | $51,046 |
| 2021 | $5,050 | $57,612 | $10,074 | $47,538 |
| 2020 | $4,873 | $55,210 | $9,654 | $45,556 |
| 2019 | $4,991 | $54,402 | $9,190 | $45,212 |
| 2018 | $4,619 | $46,305 | $8,773 | $37,532 |
| 2017 | $4,422 | $43,459 | $8,234 | $35,225 |
| 2016 | $4,257 | $40,616 | $7,695 | $32,921 |
| 2013 | -- | $39,989 | $7,577 | $32,412 |
Source: Public Records
Map
Nearby Homes
- 4602 W Northfox Ln Unit 7
- 4712 W Oakwood Dr Unit 4
- 1013 Hampton Ct
- 1105 Somerset Mall
- 4113 W Crystal Lake Rd
- 4101 Crestwood St
- 606 Waters Edge Dr Unit A
- 4104 W Elm St
- 5101 W Elm St
- 926 Front St
- 914 Front St
- 5108 Home Ave Unit 3
- 3012 Justen Ln
- 3912 W West Ave
- 6447 Illinois 120
- 907 Center St
- 4804 Willow Ln
- 3904 Grove Ave
- 1702 Parklane Ave
- 3804 Waukegan Rd
- 920 Royal Dr
- 924 Royal Dr
- 918 Royal Dr
- 4623 Front Royal Dr
- 923 Royal Dr
- 921 Royal Dr
- 4621 Front Royal Dr
- 914 Royal Dr
- 919 Royal Dr
- 4614 W Northfox Ln Unit E6
- 4614 W Northfox Ln Unit E1
- 4614 W Northfox Ln Unit E3
- 4614 W Northfox Ln Unit 2E
- 4614 W Northfox Ln Unit E5
- 4614 W Northfox Ln Unit E4
- 4614 W Northfox Ln Unit E7
- 4614 W Northfox Ln Unit 8
- 4614 W Northfox Ln Unit 7
- 4614 W Northfox Ln Unit 5
- 4614 W Northfox Ln
Your Personal Tour Guide
Ask me questions while you tour the home.