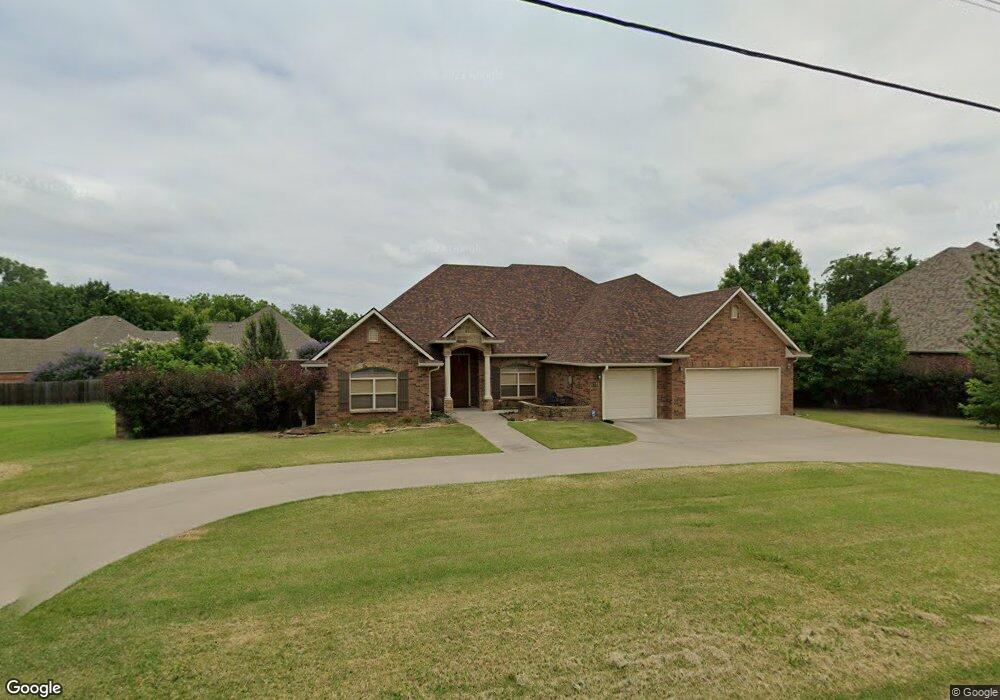
922 Sunset Dr SW Ardmore, OK 73401
Estimated Value: $356,000 - $420,579
3
Beds
2
Baths
2,541
Sq Ft
$153/Sq Ft
Est. Value
About This Home
This home is located at 922 Sunset Dr SW, Ardmore, OK 73401 and is currently estimated at $387,895, approximately $152 per square foot. 922 Sunset Dr SW is a home located in Carter County with nearby schools including Plainview Primary School, Plainview Intermediate School, and Plainview Middle School.
Ownership History
Date
Name
Owned For
Owner Type
Purchase Details
Closed on
Apr 20, 2006
Sold by
Morgan Development Llc
Bought by
Velasquez Torbio C and Velasquez Evelyn R
Current Estimated Value
Home Financials for this Owner
Home Financials are based on the most recent Mortgage that was taken out on this home.
Original Mortgage
$56,350
Outstanding Balance
$44,286
Interest Rate
6.32%
Mortgage Type
Credit Line Revolving
Estimated Equity
$343,609
Purchase Details
Closed on
Apr 20, 2005
Sold by
Bennett Robert M and Bennett Jody Denney
Bought by
Morgan Development Llc
Purchase Details
Closed on
May 26, 2004
Sold by
Brunner Devereux S and Brunner Ro
Bought by
Bennett Robert and Bennett Jody D
Create a Home Valuation Report for This Property
The Home Valuation Report is an in-depth analysis detailing your home's value as well as a comparison with similar homes in the area
Home Values in the Area
Average Home Value in this Area
Purchase History
| Date | Buyer | Sale Price | Title Company |
|---|---|---|---|
| Velasquez Torbio C | $282,000 | -- | |
| Morgan Development Llc | $27,000 | -- | |
| Bennett Robert | $25,000 | -- |
Source: Public Records
Mortgage History
| Date | Status | Borrower | Loan Amount |
|---|---|---|---|
| Open | Velasquez Torbio C | $56,350 |
Source: Public Records
Tax History Compared to Growth
Tax History
| Year | Tax Paid | Tax Assessment Tax Assessment Total Assessment is a certain percentage of the fair market value that is determined by local assessors to be the total taxable value of land and additions on the property. | Land | Improvement |
|---|---|---|---|---|
| 2024 | $3,960 | $41,106 | $4,200 | $36,906 |
| 2023 | $3,771 | $39,148 | $4,200 | $34,948 |
| 2022 | $3,377 | $37,284 | $4,200 | $33,084 |
| 2021 | $3,308 | $35,509 | $4,200 | $31,309 |
| 2020 | $3,184 | $33,818 | $5,220 | $28,598 |
| 2019 | $2,954 | $32,208 | $5,220 | $26,988 |
| 2018 | $2,950 | $32,484 | $5,220 | $27,264 |
| 2017 | $2,980 | $32,661 | $5,220 | $27,441 |
| 2016 | $3,056 | $33,302 | $5,220 | $28,082 |
| 2015 | $3,156 | $33,430 | $3,240 | $30,190 |
| 2014 | $3,054 | $32,270 | $3,240 | $29,030 |
Source: Public Records
Map
Nearby Homes
- 835 Sunset Ct
- 1831 Sunset Park Terrace
- 1834 Sunset Park Terrace
- 824 Sunset Dr SW
- 917 Q St SW
- 930 P St SW Unit 3
- 820 Virginia Ln
- 1800 SW 6th St
- 1616 6th Ave SW
- 924 Manor Mall
- 2200 Cloverleaf Place
- 1121 Surrey Dr
- 2212 Cloverleaf Place
- 535 Sunset Dr SW
- 811 Rosewood St
- 2222 Cloverleaf Place
- 1223 Buckingham
- 1507 Sunny Ln
- 711 N St SW
- 1508 Sunny Ln
- 926 Sunset Dr SW
- 829 Sunset Ct
- 833 Sunset Ct
- 913 Sunset Dr SW
- 827 Sunset Ct
- 930 Sunset Dr SW
- 921 Sunset Dr SW
- 837 Sunset Ct
- 1900 Cloverleaf Place
- 828 Sunset Ct
- 839 Sunset Ct
- 000 Sunset Ct
- 929 Sunset Dr SW
- 834 Sunset Ct
- 1827 Sunset Park Terrace
- 1820 Hollingsworth Dr
- 1823 Sunset Park Terrace
- 01 Forest Ln
- 1905 Mockingbird Ln