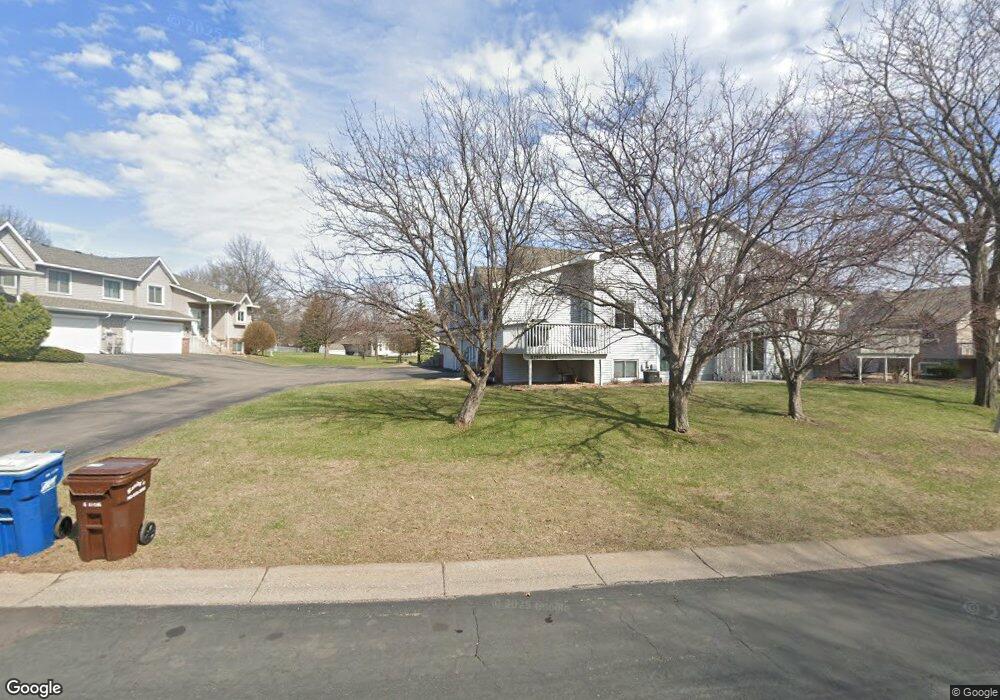
9222 Upland Ln N Maple Grove, MN 55369
Estimated Value: $268,941 - $328,000
2
Beds
2
Baths
1,057
Sq Ft
$278/Sq Ft
Est. Value
About This Home
This home is located at 9222 Upland Ln N, Maple Grove, MN 55369 and is currently estimated at $293,985, approximately $278 per square foot. 9222 Upland Ln N is a home located in Hennepin County with nearby schools including Fernbrook Elementary School, Osseo Middle School, and Maple Grove Senior High School.
Ownership History
Date
Name
Owned For
Owner Type
Purchase Details
Closed on
Aug 21, 2017
Sold by
Oltmann Tavis and Oltmann Sarah B
Bought by
Wiltrout Jay S and Wiltrout Katherine J
Current Estimated Value
Home Financials for this Owner
Home Financials are based on the most recent Mortgage that was taken out on this home.
Original Mortgage
$146,000
Outstanding Balance
$121,765
Interest Rate
4.03%
Mortgage Type
VA
Estimated Equity
$172,220
Purchase Details
Closed on
Sep 6, 2007
Sold by
Deutsche Bank National Trust Co
Bought by
Oltmonn Travis and Oltmonn Sarah B
Purchase Details
Closed on
Jan 30, 2003
Sold by
Thornburgh Timothy M
Bought by
Combs Annette
Purchase Details
Closed on
Nov 26, 1996
Sold by
Greenwood Merlyn S and Greenwood Marian L
Bought by
Thornburgh Timothy M
Create a Home Valuation Report for This Property
The Home Valuation Report is an in-depth analysis detailing your home's value as well as a comparison with similar homes in the area
Home Values in the Area
Average Home Value in this Area
Purchase History
| Date | Buyer | Sale Price | Title Company |
|---|---|---|---|
| Wiltrout Jay S | $146,000 | Executive Title | |
| Oltmonn Travis | $155,000 | -- | |
| Combs Annette | $160,500 | -- | |
| Thornburgh Timothy M | $18,300 | -- | |
| Thornburgh Timothy Mark | $73,200 | -- |
Source: Public Records
Mortgage History
| Date | Status | Borrower | Loan Amount |
|---|---|---|---|
| Open | Wiltrout Jay S | $146,000 |
Source: Public Records
Tax History Compared to Growth
Tax History
| Year | Tax Paid | Tax Assessment Tax Assessment Total Assessment is a certain percentage of the fair market value that is determined by local assessors to be the total taxable value of land and additions on the property. | Land | Improvement |
|---|---|---|---|---|
| 2024 | -- | $291,300 | $72,400 | $218,900 |
| 2023 | $3,068 | $271,600 | $50,700 | $220,900 |
| 2022 | $2,423 | $252,400 | $41,100 | $211,300 |
| 2021 | $2,337 | $214,400 | $40,900 | $173,500 |
| 2020 | $2,400 | $204,600 | $30,400 | $174,200 |
| 2019 | $2,368 | $200,100 | $31,500 | $168,600 |
| 2018 | $2,101 | $188,200 | $31,500 | $156,700 |
| 2017 | $1,934 | $151,200 | $28,000 | $123,200 |
| 2016 | $1,833 | $143,200 | $30,000 | $113,200 |
| 2015 | $1,518 | $120,700 | $10,000 | $110,700 |
| 2014 | -- | $115,400 | $17,000 | $98,400 |
Source: Public Records
Map
Nearby Homes
- 9340 Ranchview Ln N
- 9228 Archer Ln N
- 9190 Archer Ln N
- 9115 Archer Ln N
- 9138 Comstock Ln N Unit 204
- 9150 Comstock Ln N
- 9536 Minnesota Ln N
- 10625 Juneau Ln N
- 8858 Comstock Ct
- 14878 95th Place N
- 14624 92nd Place N
- 14661 94th Place N
- 8713 Blackoaks Ln N
- 8883 Fountain Ln N
- 8566 Quarles Rd
- 14402 91st Place N
- 17198 93rd Place N Unit 62
- 9477 Jewel Ln N
- 9440 Jewel Ln N
- 10145 Peony Ln N
- 9216 Upland Ln N
- 9234 Upland Ln N
- 9220 Upland Ln N
- 9218 Upland Ln N
- 9236 Upland Ln N
- 9202 Upland Ln N
- 9225 Upland Ln N
- 9240 Upland Ln N
- 9219 Upland Ln N
- 9200 Upland Ln N
- 9238 Upland Ln N
- 9213 Upland Ln N
- 9239 Upland Ln N
- 9196 Upland Ln N
- 9254 Upland Ln N
- 9207 Upland Ln N
- 9198 Upland Ln N
- 9256 Upland Ln N
- 9245 Upland Ln N
- 15634 92nd Ave N