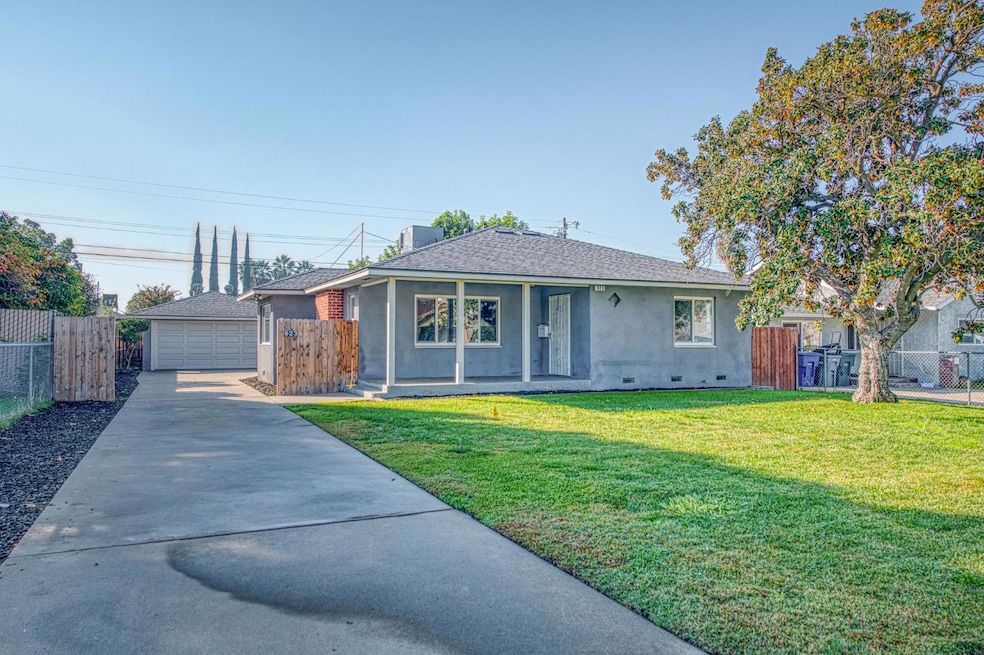
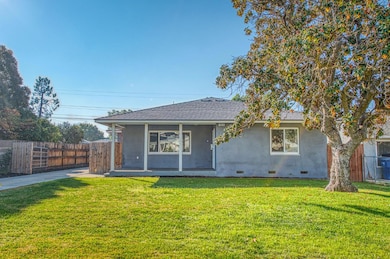
923 W Clinton Ave Fresno, CA 93705
Roeding Park NeighborhoodEstimated payment $1,889/month
Highlights
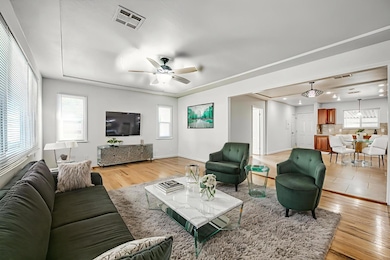
- Wood Flooring
- Double Pane Windows
- 1-Story Property
- Covered Patio or Porch
- Bathtub with Shower
- Central Heating and Cooling System
About This Home
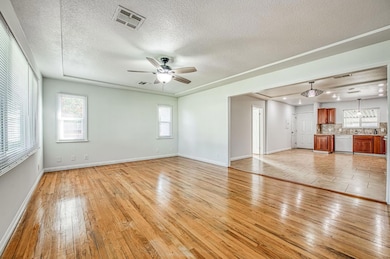
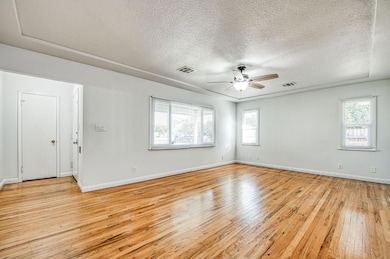
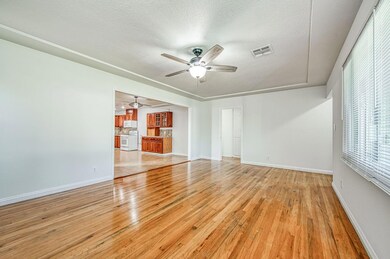
Welcome to 923 W Clinton Ave in Fresno! This charming 3-bedroom, 2-bathroom home blends classic character with modern upgrades on a spacious lot. Step inside to discover original hardwood floors that bring warmth and timeless appeal, complemented by dual pane windows that provide comfort and efficiency. The upgraded roof and HVAC system ensure peace of mind for years to come. Outdoors, the larger lot offers room to relax, entertain, or garden. Mature fruit trees, including orange and avocado, create a delightful backyard retreat, while the covered patio is perfect for enjoying Fresno's sunny days. Ideally located near the desirable Fresno High neighborhood, this home provides easy access to schools, shopping, dining, and local amenities. Whether you're a first-time buyer or looking for a home with both charm and functionality, 923 W Clinton Ave offers a wonderful opportunity to make your own.
Home Details
Home Type
- Single Family
Est. Annual Taxes
- $1,248
Year Built
- Built in 1951
Lot Details
- 7,740 Sq Ft Lot
- Lot Dimensions are 60x129
- Front and Back Yard Sprinklers
- Property is zoned RS5
Home Design
- Wood Foundation
- Composition Roof
- Stucco
Interior Spaces
- 1,349 Sq Ft Home
- 1-Story Property
- Double Pane Windows
- Laundry in Garage
Kitchen
- Oven or Range
- Dishwasher
- Disposal
Flooring
- Wood
- Tile
Bedrooms and Bathrooms
- 3 Bedrooms
- 2 Bathrooms
- Bathtub with Shower
- Separate Shower
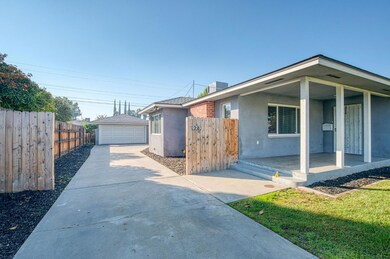
Parking
- Automatic Garage Door Opener
- On-Street Parking
Additional Features
- Covered Patio or Porch
- Central Heating and Cooling System
Map
Home Values in the Area
Average Home Value in this Area
Tax History
| Year | Tax Paid | Tax Assessment Tax Assessment Total Assessment is a certain percentage of the fair market value that is determined by local assessors to be the total taxable value of land and additions on the property. | Land | Improvement |
|---|---|---|---|---|
| 2025 | $1,248 | $94,632 | $32,185 | $62,447 |
| 2023 | $1,179 | $90,959 | $30,936 | $60,023 |
| 2022 | $1,163 | $89,177 | $30,330 | $58,847 |
| 2021 | $1,131 | $87,430 | $29,736 | $57,694 |
| 2020 | $1,127 | $86,535 | $29,432 | $57,103 |
| 2019 | $1,084 | $84,839 | $28,855 | $55,984 |
| 2018 | $1,061 | $83,177 | $28,290 | $54,887 |
| 2017 | $1,043 | $81,547 | $27,736 | $53,811 |
| 2016 | $1,009 | $79,949 | $27,193 | $52,756 |
| 2015 | $817 | $64,400 | $21,800 | $42,600 |
| 2014 | $766 | $60,400 | $20,500 | $39,900 |
Property History
| Date | Event | Price | List to Sale | Price per Sq Ft |
|---|---|---|---|---|
| 11/06/2025 11/06/25 | Pending | -- | -- | -- |
| 10/30/2025 10/30/25 | For Sale | $339,000 | -- | $251 / Sq Ft |
Purchase History
| Date | Type | Sale Price | Title Company |
|---|---|---|---|
| Grant Deed | $73,500 | First American Title Ins Co | |
| Trustee Deed | $168,750 | None Available | |
| Grant Deed | $216,000 | Financial Title Company |
Mortgage History
| Date | Status | Loan Amount | Loan Type |
|---|---|---|---|
| Open | $58,800 | Purchase Money Mortgage | |
| Previous Owner | $43,200 | Stand Alone Second | |
| Previous Owner | $172,800 | Purchase Money Mortgage |
Source: Fresno MLS
MLS Number: 639284
APN: 444-032-21
Disclaimer: Certain information contained herein is derived from information provided by parties other than Homes.com. All information provided is deemed reliable, but is not guaranteed to be accurate and should be independently verified.
![]() IDX information is provided exclusively for personal, non-commercial use, and may not be used for any purpose other than to identify prospective properties consumers may be interested in purchasing. Information is deemed reliable but not guaranteed.
IDX information is provided exclusively for personal, non-commercial use, and may not be used for any purpose other than to identify prospective properties consumers may be interested in purchasing. Information is deemed reliable but not guaranteed.
- 934 W Terrace Ave
- 728 W Vassar Ave
- 935 W Princeton Ave
- 506 W Terrace Ave
- 804 W Michigan Ave
- 818 W Peralta Way
- 1417 W Princeton Ave
- 2110 N Vagedes Ave
- 1906 N Fruit Ave
- 2035 N Arthur Ave
- 1421 W Michigan Ave
- 1717 N Brooks Ave
- 2649 N Adoline Ave
- 112 W Vassar Ave
- 1523 W Cornell Ave
- 1562 N Fay Ave
- 1718 W Normal Ave
- 1549 N Delno Ave
- 1559 N Carruth Ave
- 1520 N Delno Ave
