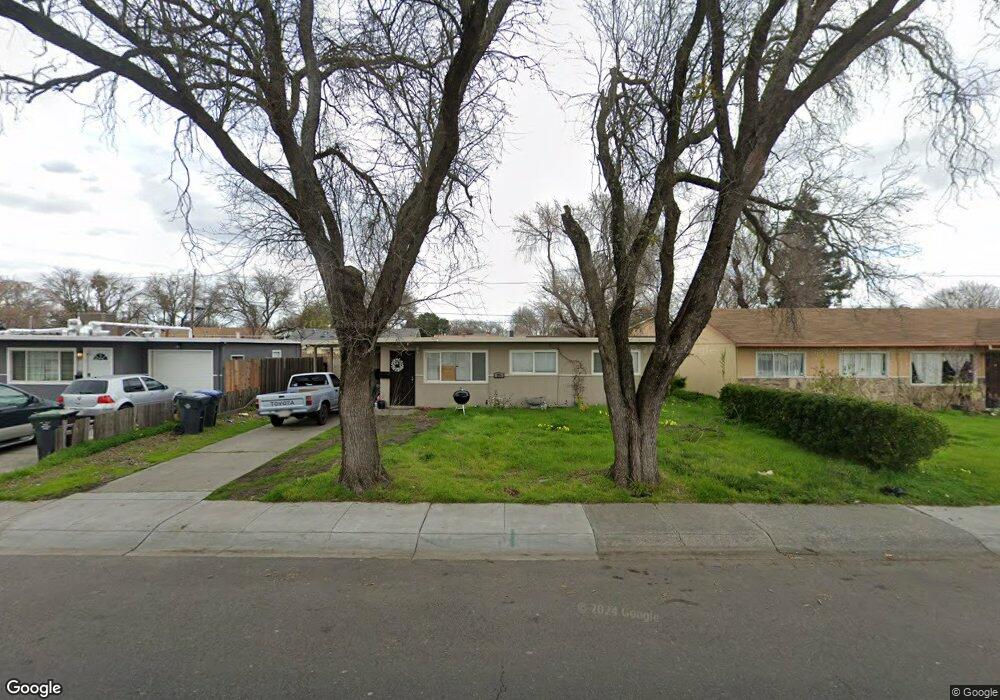
924 2nd St Fairfield, CA 94533
Estimated Value: $347,000 - $397,000
3
Beds
1
Bath
980
Sq Ft
$386/Sq Ft
Est. Value
About This Home
This home is located at 924 2nd St, Fairfield, CA 94533 and is currently estimated at $377,918, approximately $385 per square foot. 924 2nd St is a home located in Solano County with nearby schools including Fairview Elementary School, Crystal Middle School, and Armijo High School.
Ownership History
Date
Name
Owned For
Owner Type
Purchase Details
Closed on
Oct 24, 2017
Sold by
2012-C Property Holding Llc
Bought by
Tah Ms Borrower Llc
Current Estimated Value
Purchase Details
Closed on
Apr 12, 2013
Sold by
Mp Res I Llc
Bought by
2012 C Property Holdings Llc
Purchase Details
Closed on
Dec 12, 2012
Sold by
Mp Res I Llc
Bought by
Mp Res I Llc
Home Financials for this Owner
Home Financials are based on the most recent Mortgage that was taken out on this home.
Original Mortgage
$71,500
Interest Rate
3.25%
Mortgage Type
Adjustable Rate Mortgage/ARM
Purchase Details
Closed on
Jan 26, 2012
Sold by
Hernandez Mirna R
Bought by
Mp Res I Llc
Purchase Details
Closed on
Dec 9, 2005
Sold by
Edman James A and Edman Margery A
Bought by
Hernandez Mirna R
Home Financials for this Owner
Home Financials are based on the most recent Mortgage that was taken out on this home.
Original Mortgage
$68,600
Interest Rate
6.35%
Mortgage Type
Stand Alone Second
Create a Home Valuation Report for This Property
The Home Valuation Report is an in-depth analysis detailing your home's value as well as a comparison with similar homes in the area
Home Values in the Area
Average Home Value in this Area
Purchase History
| Date | Buyer | Sale Price | Title Company |
|---|---|---|---|
| Tah Ms Borrower Llc | -- | None Available | |
| 2012 C Property Holdings Llc | $131,500 | None Available | |
| Mp Res I Llc | -- | First American Title Company | |
| Mp Res I Llc | $77,490 | None Available | |
| Hernandez Mirna R | $343,000 | Frontier Title Co |
Source: Public Records
Mortgage History
| Date | Status | Borrower | Loan Amount |
|---|---|---|---|
| Previous Owner | Mp Res I Llc | $71,500 | |
| Previous Owner | Hernandez Mirna R | $68,600 | |
| Previous Owner | Hernandez Mirna R | $274,400 |
Source: Public Records
Tax History Compared to Growth
Tax History
| Year | Tax Paid | Tax Assessment Tax Assessment Total Assessment is a certain percentage of the fair market value that is determined by local assessors to be the total taxable value of land and additions on the property. | Land | Improvement |
|---|---|---|---|---|
| 2025 | $1,826 | $161,553 | $36,938 | $124,615 |
| 2024 | $1,826 | $158,386 | $36,214 | $122,172 |
| 2023 | $1,770 | $155,281 | $35,504 | $119,777 |
| 2022 | $1,749 | $152,237 | $34,808 | $117,429 |
| 2021 | $1,732 | $149,253 | $34,126 | $115,127 |
| 2020 | $1,692 | $147,724 | $33,777 | $113,947 |
| 2019 | $1,651 | $144,828 | $33,115 | $111,713 |
| 2018 | $1,704 | $141,989 | $32,466 | $109,523 |
| 2017 | $1,626 | $139,206 | $31,830 | $107,376 |
| 2016 | $1,607 | $136,477 | $31,206 | $105,271 |
| 2015 | $1,501 | $134,428 | $30,738 | $103,690 |
| 2014 | $1,487 | $131,795 | $30,136 | $101,659 |
Source: Public Records
Map
Nearby Homes
- 1042 Hayes St
- 1007 4th St
- 1412 Hawaii St
- 1443 Minnesota St
- 1661 Minnesota St
- 1200 Truman St
- 1024 Tyler St
- 1032 Tyler St
- 1731 Michigan St
- 1842 Minnesota St
- 1316 Lincoln St
- 899 Taylor St
- 1625 Park Ln Unit 11
- 1216 Lincoln St
- 1201 Missouri St
- 527 Great Jones St
- 519 Taylor St
- 745 Jackson St
- 729 Georgia Way
- 0 Madison St