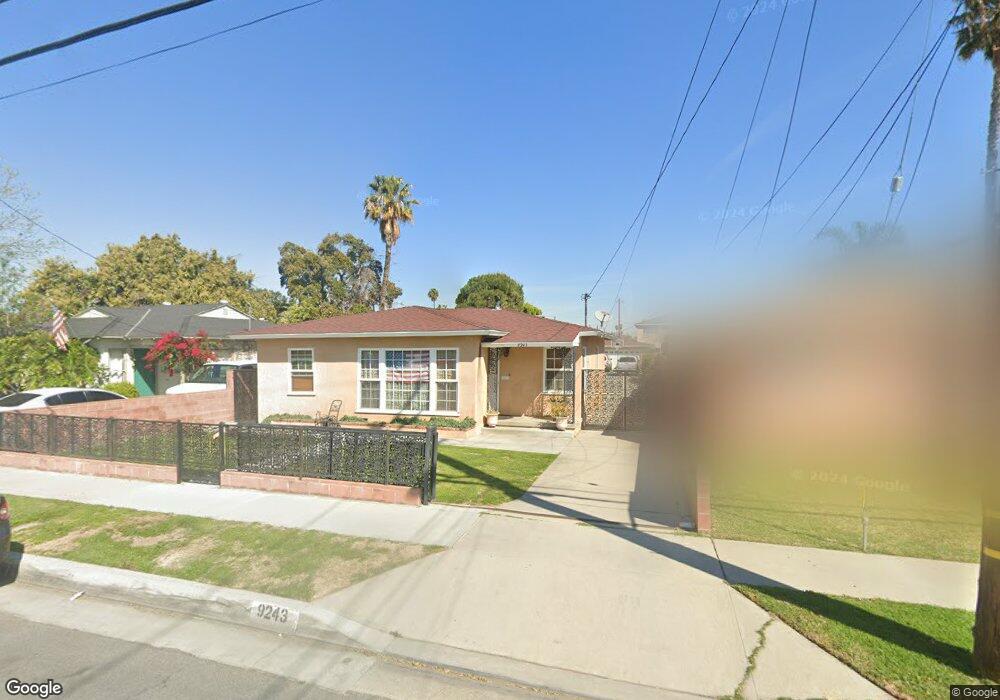
9243 Rose St Bellflower, CA 90706
Estimated Value: $823,000 - $959,507
4
Beds
2
Baths
1,832
Sq Ft
$475/Sq Ft
Est. Value
About This Home
This home is located at 9243 Rose St, Bellflower, CA 90706 and is currently estimated at $870,627, approximately $475 per square foot. 9243 Rose St is a home located in Los Angeles County with nearby schools including Craig Williams Elementary School, Mayfair High School, and St. Pancratius Parish School.
Ownership History
Date
Name
Owned For
Owner Type
Purchase Details
Closed on
Apr 9, 2004
Sold by
Griffin Jeffrey C and Marshall Teresa J
Bought by
Urbina Marcos
Current Estimated Value
Home Financials for this Owner
Home Financials are based on the most recent Mortgage that was taken out on this home.
Original Mortgage
$310,400
Outstanding Balance
$143,109
Interest Rate
5.37%
Mortgage Type
Purchase Money Mortgage
Estimated Equity
$727,518
Purchase Details
Closed on
Oct 10, 2001
Sold by
Griffin Jeffrey C
Bought by
Griffin Jeffrey C
Purchase Details
Closed on
Sep 28, 2001
Sold by
Griffin Gay L
Bought by
Griffin Jeffrey C
Purchase Details
Closed on
Jan 25, 1994
Sold by
Griffin Jamie L
Bought by
Foulkrod Marc J and Griffin Jamie L
Create a Home Valuation Report for This Property
The Home Valuation Report is an in-depth analysis detailing your home's value as well as a comparison with similar homes in the area
Home Values in the Area
Average Home Value in this Area
Purchase History
| Date | Buyer | Sale Price | Title Company |
|---|---|---|---|
| Urbina Marcos | $388,000 | First American Title Co Of L | |
| Griffin Jeffrey C | -- | Commonwealth Land Title Co | |
| Griffin Jeffrey C | -- | Commonwealth Land Title Co | |
| Foulkrod Marc J | -- | -- |
Source: Public Records
Mortgage History
| Date | Status | Borrower | Loan Amount |
|---|---|---|---|
| Open | Urbina Marcos | $310,400 | |
| Closed | Urbina Marcos | $77,600 |
Source: Public Records
Tax History
| Year | Tax Paid | Tax Assessment Tax Assessment Total Assessment is a certain percentage of the fair market value that is determined by local assessors to be the total taxable value of land and additions on the property. | Land | Improvement |
|---|---|---|---|---|
| 2025 | $7,748 | $649,278 | $399,657 | $249,621 |
| 2024 | $7,748 | $636,548 | $391,821 | $244,727 |
| 2023 | $7,435 | $624,068 | $384,139 | $239,929 |
| 2022 | $7,301 | $611,832 | $376,607 | $235,225 |
| 2021 | $7,150 | $599,836 | $369,223 | $230,613 |
| 2019 | $6,962 | $582,047 | $358,273 | $223,774 |
| 2018 | $6,669 | $570,636 | $351,249 | $219,387 |
| 2016 | $5,997 | $512,000 | $314,500 | $197,500 |
| 2015 | $5,956 | $512,000 | $314,500 | $197,500 |
| 2014 | $5,411 | $460,000 | $282,600 | $177,400 |
Source: Public Records
Map
Nearby Homes
- 9319 Cedar St Unit C
- 4415 Ashworth St
- 9133 Ramona St Unit 2
- 9235 Artesia Blvd Unit 5
- 9200 Palm St Unit 6
- 9240 Palm St
- 6142 Oliva Ave
- 5975 Pepperwood Ave
- 5942 Fidler Ave
- 4332 Andy St
- 5931 Pimenta Ave
- 5808 Pennswood Ave
- 17046 Clark Ave
- 5851 Premiere Ave
- 6118 Amos Ave
- 8723 Artesia Blvd Unit 38
- 5913 Castana Ave
- 6127 Adenmoor Ave
- 8819 Park St Unit 29
- 3806 E Arabella St
Your Personal Tour Guide
Ask me questions while you tour the home.