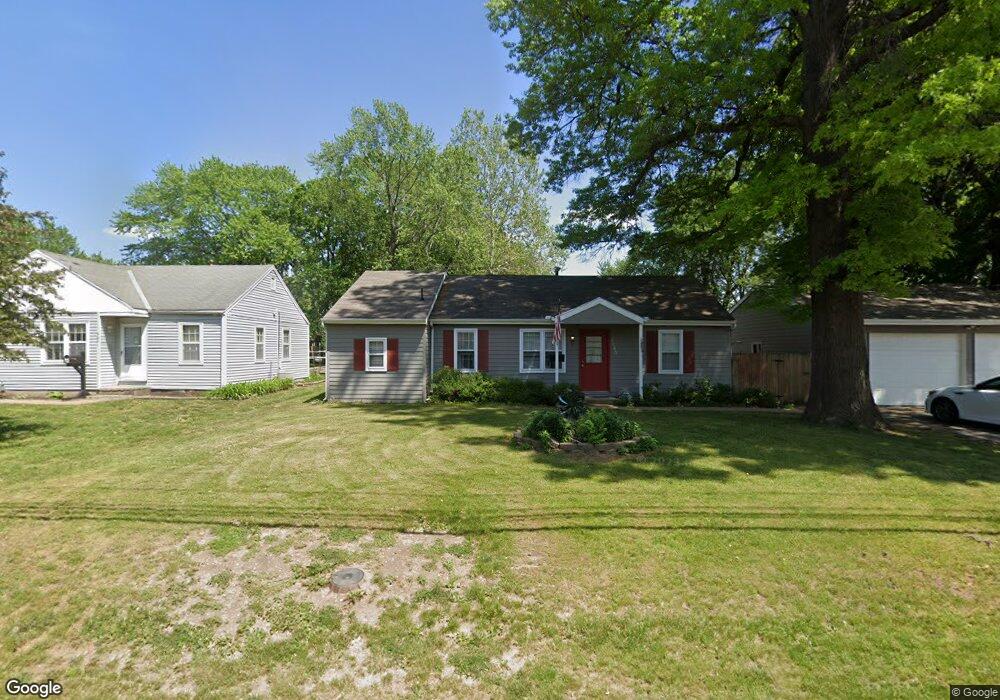
9245 Noland Rd Lenexa, KS 66215
Estimated Value: $286,000 - $331,000
3
Beds
2
Baths
1,802
Sq Ft
$175/Sq Ft
Est. Value
About This Home
This home is located at 9245 Noland Rd, Lenexa, KS 66215 and is currently estimated at $315,383, approximately $175 per square foot. 9245 Noland Rd is a home located in Johnson County with nearby schools including Sunflower Elementary School, Westridge Middle School, and Shawnee Mission West High School.
Ownership History
Date
Name
Owned For
Owner Type
Purchase Details
Closed on
Mar 15, 2018
Sold by
Frohling David L and Frohling Debra F
Bought by
Advantage Properties Ks Llc
Current Estimated Value
Purchase Details
Closed on
Jan 24, 2007
Sold by
Hsbc Bank Usa Na
Bought by
Frohling Dave L and Frohling Debra F
Home Financials for this Owner
Home Financials are based on the most recent Mortgage that was taken out on this home.
Original Mortgage
$20,100
Interest Rate
6.1%
Mortgage Type
New Conventional
Purchase Details
Closed on
Apr 20, 2006
Sold by
Kinga Betty and Doe John
Bought by
Hsbc Bank Usa Na
Purchase Details
Closed on
Mar 26, 2004
Sold by
King Betty and King Betty J
Bought by
King Betty J
Home Financials for this Owner
Home Financials are based on the most recent Mortgage that was taken out on this home.
Original Mortgage
$131,750
Interest Rate
6.85%
Mortgage Type
New Conventional
Purchase Details
Closed on
Feb 18, 2003
Sold by
Gordon Dale W and Gordon Billie E
Bought by
King Betty Jean and King Betty
Home Financials for this Owner
Home Financials are based on the most recent Mortgage that was taken out on this home.
Original Mortgage
$116,000
Interest Rate
8.4%
Create a Home Valuation Report for This Property
The Home Valuation Report is an in-depth analysis detailing your home's value as well as a comparison with similar homes in the area
Home Values in the Area
Average Home Value in this Area
Purchase History
| Date | Buyer | Sale Price | Title Company |
|---|---|---|---|
| Advantage Properties Ks Llc | -- | None Available | |
| Frohling Dave L | -- | Continental Title Co | |
| Hsbc Bank Usa Na | $129,917 | Continental Title Co | |
| King Betty J | -- | Capital Title Agency Inc | |
| King Betty Jean | -- | -- |
Source: Public Records
Mortgage History
| Date | Status | Borrower | Loan Amount |
|---|---|---|---|
| Previous Owner | Frohling Dave L | $20,100 | |
| Previous Owner | Frohling Dave L | $100,500 | |
| Previous Owner | King Betty J | $131,750 | |
| Previous Owner | King Betty Jean | $116,000 |
Source: Public Records
Tax History Compared to Growth
Tax History
| Year | Tax Paid | Tax Assessment Tax Assessment Total Assessment is a certain percentage of the fair market value that is determined by local assessors to be the total taxable value of land and additions on the property. | Land | Improvement |
|---|---|---|---|---|
| 2024 | $2,901 | $26,462 | $6,314 | $20,148 |
| 2023 | $2,724 | $24,150 | $5,735 | $18,415 |
| 2022 | $2,844 | $25,185 | $5,214 | $19,971 |
| 2021 | $2,411 | $20,079 | $4,960 | $15,119 |
| 2020 | $2,283 | $18,802 | $4,509 | $14,293 |
| 2019 | $2,210 | $18,181 | $3,758 | $14,423 |
| 2018 | $2,430 | $19,872 | $3,758 | $16,114 |
| 2017 | $2,069 | $16,330 | $3,422 | $12,908 |
| 2016 | $1,856 | $14,421 | $3,422 | $10,999 |
| 2015 | $1,710 | $13,340 | $3,422 | $9,918 |
| 2013 | -- | $12,075 | $3,422 | $8,653 |
Source: Public Records
Map
Nearby Homes
- 13017 W 92nd St
- 12894 W 93rd St
- 13312 W 91st St
- 12122 W 92nd St
- 14101 W 88th Place
- 9029 Acuff Ln
- 9948 Rosehill Rd
- 8545 Westgate St
- 9202 Greenway Ln
- 10184 Haskins St
- 13013 W 101st St
- 9318 Greenway Ln
- 12022 W 100th St
- 13300 W 102nd St
- 8641 Greenwood Ln
- 8919 Greenway Ln
- 13136 W 84th St
- 10211 Hauser St
- 13212 W 84th St
- 9131 Darnell St
- 9241 Noland Rd
- 13022 W 93rd St
- 13006 W 93rd St
- 9248 Noland Rd
- 9252 Noland Rd
- 9240 Noland Rd
- 12922 W 93rd St
- 9236 Noland Rd
- 9256 Noland Rd
- 9301 Noland Rd
- 13009 W 93rd St
- 9260 Noland Rd
- 13109 Oak St
- 13001 W 93rd St
- 12914 W 93rd St
- 9308 Noland Rd
- 13023 W 92nd St
- 13011 W 92nd St
- 12923 W 93rd St
- 9311 Noland Rd