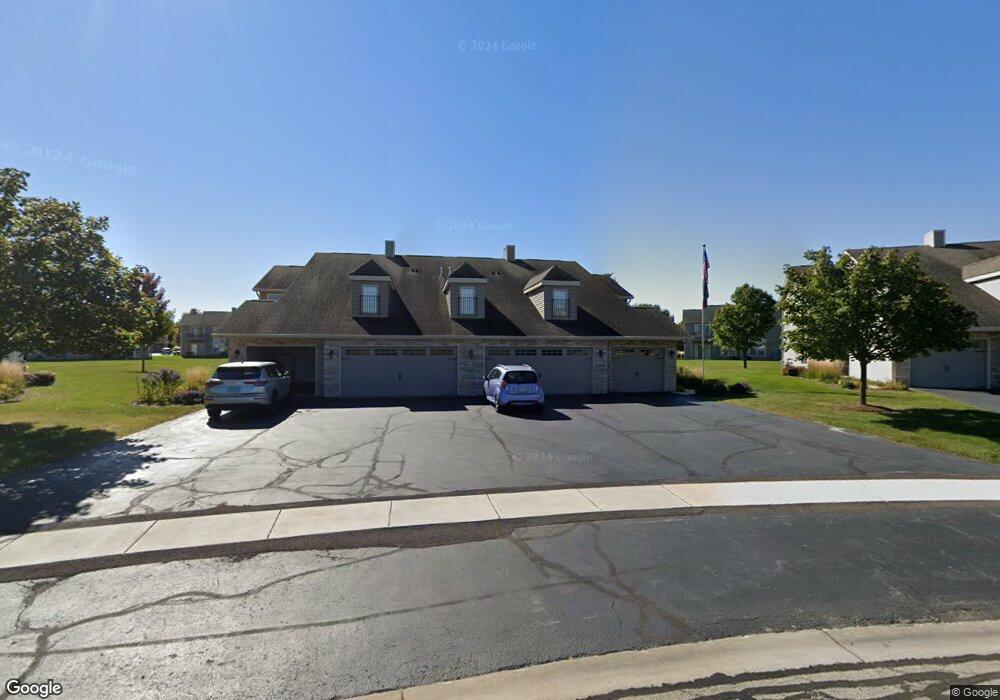
925 Arvle Cir Unit 30 LL Sycamore, IL 60178
Estimated Value: $211,000 - $223,338
2
Beds
8
Baths
1,350
Sq Ft
$160/Sq Ft
Est. Value
About This Home
This home is located at 925 Arvle Cir Unit 30 LL, Sycamore, IL 60178 and is currently estimated at $216,585, approximately $160 per square foot. 925 Arvle Cir Unit 30 LL is a home located in DeKalb County with nearby schools including Sycamore High School, St Mary's Catholic School, and Cornerstone Christian Academy.
Ownership History
Date
Name
Owned For
Owner Type
Purchase Details
Closed on
Jul 17, 2014
Sold by
Sheeks Trust
Bought by
Cebulski Mary K
Current Estimated Value
Home Financials for this Owner
Home Financials are based on the most recent Mortgage that was taken out on this home.
Original Mortgage
$96,000
Outstanding Balance
$73,205
Interest Rate
4.19%
Mortgage Type
New Conventional
Estimated Equity
$143,380
Purchase Details
Closed on
Apr 8, 2014
Sold by
Sheeks Donald E
Bought by
Sheeks Trust
Purchase Details
Closed on
Mar 11, 2014
Sold by
White Rocky W
Bought by
Sheeks Donald E
Purchase Details
Closed on
Dec 18, 2013
Sold by
Sms Ventures Llc
Bought by
White Rocky W and White Gloria M
Home Financials for this Owner
Home Financials are based on the most recent Mortgage that was taken out on this home.
Original Mortgage
$88,000
Interest Rate
3.25%
Mortgage Type
New Conventional
Purchase Details
Closed on
Oct 28, 2005
Sold by
Youssi Development Group Llc
Bought by
Sms Ventures Llc
Create a Home Valuation Report for This Property
The Home Valuation Report is an in-depth analysis detailing your home's value as well as a comparison with similar homes in the area
Home Values in the Area
Average Home Value in this Area
Purchase History
| Date | Buyer | Sale Price | Title Company |
|---|---|---|---|
| Cebulski Mary K | $120,000 | -- | |
| Sheeks Trust | -- | -- | |
| Sheeks Donald E | $118,500 | -- | |
| White Rocky W | $112,500 | -- | |
| Sms Ventures Llc | $140,000 | -- |
Source: Public Records
Mortgage History
| Date | Status | Borrower | Loan Amount |
|---|---|---|---|
| Open | Cebulski Mary K | $96,000 | |
| Previous Owner | White Rocky W | $88,000 |
Source: Public Records
Tax History Compared to Growth
Tax History
| Year | Tax Paid | Tax Assessment Tax Assessment Total Assessment is a certain percentage of the fair market value that is determined by local assessors to be the total taxable value of land and additions on the property. | Land | Improvement |
|---|---|---|---|---|
| 2024 | $4,254 | $58,063 | $14,517 | $43,546 |
| 2023 | $4,254 | $53,020 | $13,256 | $39,764 |
| 2022 | $4,040 | $48,629 | $12,158 | $36,471 |
| 2021 | $3,826 | $45,653 | $11,414 | $34,239 |
| 2020 | $3,765 | $44,530 | $11,133 | $33,397 |
| 2019 | $3,696 | $43,554 | $10,889 | $32,665 |
| 2018 | $3,623 | $42,233 | $10,559 | $31,674 |
| 2017 | $3,521 | $40,562 | $10,141 | $30,421 |
| 2016 | $3,419 | $38,711 | $9,678 | $29,033 |
| 2015 | -- | $34,570 | $8,793 | $25,777 |
| 2014 | -- | $32,827 | $8,350 | $24,477 |
| 2013 | -- | $33,456 | $8,510 | $24,946 |
Source: Public Records
Map
Nearby Homes
- 955 Buckingham Dr
- 1071 Alexandria Dr
- 22 Kloe Ln Unit 22
- 56 Briden Ln Unit 56
- 18 Kloe Ln Unit 18
- 1147 Alexandria Dr
- Blue Bell Plan at Old Mill Park Condos
- Sun Flower Plan at Old Mill Park Condos
- Prairie Rose Plan at Old Mill Park Condos
- Cone Flower Plan at Old Mill Park Condos
- 44 Kloe Ln Unit 44
- 60 Kloe Ln Unit 60
- 64 Kloe Ln Unit 64
- 13 Briden Ln Unit 13
- 134 Brian St
- 1310 Arneita St
- 1340 N Main St
- 528 E Sycamore St
- TBD Plaza Dr
- TBD Aberdeen Ct
- 921 Arvle Cir
- 923 Arvle Cir
- 923 Arvle Cir Unit 1
- 925 Arvle Cir
- 927 Arvle Cir
- 927 Arvle Cir Unit 30 UL
- 931 Arvle Cir
- 931 Arvle Cir Unit 29LR
- 933 Arvle Cir
- 935 Arvle Cir
- 935 Arvle Cir Unit 29LL
- 937 Arvle Cir
- 941 Arvle Cir
- 943 Arvle Cir
- 945 Arvle Cir
- 947 Arvle Cir
- 977 Arvle Cir
- 977 Arvle Cir Unit 1
- 951 Arvle Cir
- 953 Arvle Cir