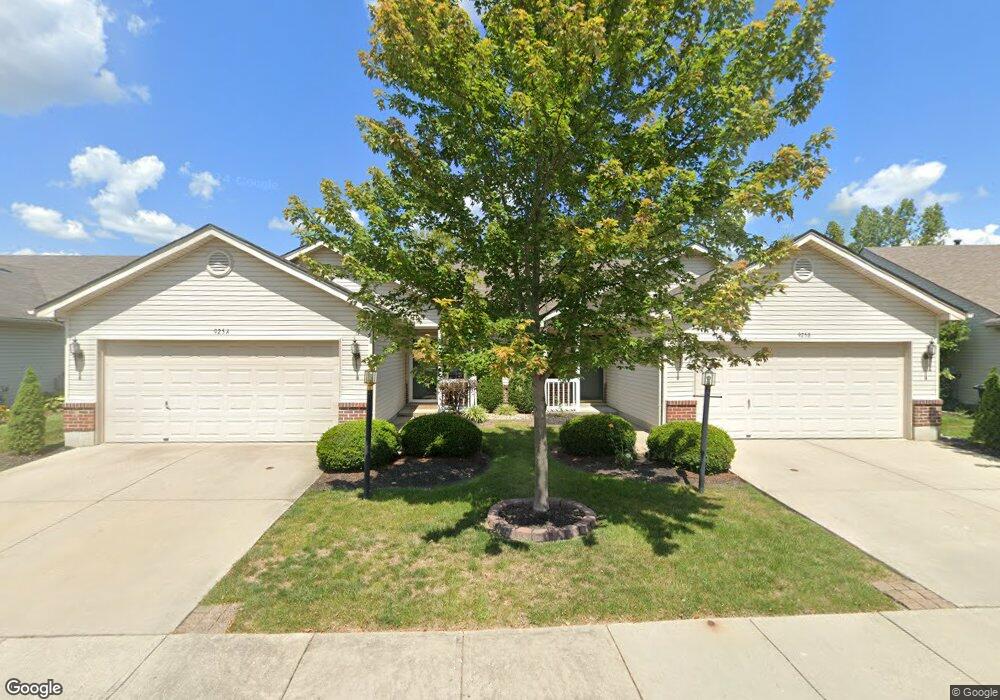
925 Dillon Way Unit B Lebanon, OH 45036
Estimated Value: $203,156 - $246,000
2
Beds
2
Baths
1,060
Sq Ft
$216/Sq Ft
Est. Value
About This Home
This home is located at 925 Dillon Way Unit B, Lebanon, OH 45036 and is currently estimated at $229,039, approximately $216 per square foot. 925 Dillon Way Unit B is a home located in Warren County with nearby schools including Bowman Primary School, Berry Intermediate School, and Donovan Elementary School.
Ownership History
Date
Name
Owned For
Owner Type
Purchase Details
Closed on
May 25, 2011
Sold by
Basham Melissa
Bought by
Olmutz David J
Current Estimated Value
Home Financials for this Owner
Home Financials are based on the most recent Mortgage that was taken out on this home.
Original Mortgage
$90,154
Interest Rate
4.81%
Mortgage Type
New Conventional
Purchase Details
Closed on
Oct 23, 2006
Sold by
Conley Gary R and Conley Marilyn K
Bought by
Basham Melissa
Purchase Details
Closed on
May 24, 2005
Sold by
Beazer Homes Investments Llc
Bought by
Conley Gary R and Conley Marilyn K
Home Financials for this Owner
Home Financials are based on the most recent Mortgage that was taken out on this home.
Original Mortgage
$119,900
Interest Rate
5.91%
Mortgage Type
Purchase Money Mortgage
Create a Home Valuation Report for This Property
The Home Valuation Report is an in-depth analysis detailing your home's value as well as a comparison with similar homes in the area
Home Values in the Area
Average Home Value in this Area
Purchase History
| Date | Buyer | Sale Price | Title Company |
|---|---|---|---|
| Olmutz David J | $87,000 | Fidelity Land Title Agency | |
| Basham Melissa | $129,000 | Prodigy Title | |
| Conley Gary R | $119,900 | Aspen Title Agency Inc |
Source: Public Records
Mortgage History
| Date | Status | Borrower | Loan Amount |
|---|---|---|---|
| Previous Owner | Olmutz David J | $90,154 | |
| Previous Owner | Conley Gary R | $119,900 |
Source: Public Records
Tax History Compared to Growth
Tax History
| Year | Tax Paid | Tax Assessment Tax Assessment Total Assessment is a certain percentage of the fair market value that is determined by local assessors to be the total taxable value of land and additions on the property. | Land | Improvement |
|---|---|---|---|---|
| 2024 | $2,080 | $59,890 | $21,000 | $38,890 |
| 2023 | $1,789 | $47,463 | $12,915 | $34,548 |
| 2022 | $1,865 | $47,464 | $12,915 | $34,549 |
| 2021 | $1,763 | $47,464 | $12,915 | $34,549 |
| 2020 | $2,080 | $38,588 | $10,500 | $28,088 |
| 2019 | $2,090 | $38,588 | $10,500 | $28,088 |
| 2018 | $1,791 | $38,588 | $10,500 | $28,088 |
| 2017 | $1,792 | $34,640 | $8,967 | $25,673 |
| 2016 | $1,849 | $34,640 | $8,967 | $25,673 |
| 2015 | $1,862 | $34,640 | $8,967 | $25,673 |
| 2014 | $1,812 | $32,370 | $8,380 | $23,990 |
| 2013 | $1,743 | $40,570 | $10,500 | $30,070 |
Source: Public Records
Map
Nearby Homes
- 941 Dillon Way
- 781 Shadow Wood Dr
- B Nelson Ln
- 0 Wilmington Rd Unit 1850287
- 0 Wilmington Rd Unit 940450
- 538 Lookout Ridge Dr
- 923 Greengate Dr
- 16 Mound St
- 513 E Warren St
- 4377 Waters Edge Ln
- 938 Whispering Pine Way
- 440 E Main St
- 111 Ridge Rd
- 417 E Warren St
- 1538 Oregonia Rd
- 850 Sand Trap Place
- N Ohio 123
- Lot Ohio 123
- 441 Bethpage Way
- 429 Bethpage Way
- 925 Dillon Way
- 925B Dillon Way
- 925A Dillon Way
- 929 Dillon Way
- 929A Dillon Way
- 921 Dillon Way Unit B
- 921 Dillon Way Unit A
- 921 Dillon Way
- 929B Dillon Way
- 930B Dominick Cir
- A Dominick Cir
- 933A Dillon Way
- 933 Dillon Way
- 933 Dillon Way Unit B
- 933 Dillon Way Unit A
- 930 Dominick Cir Unit B
- 930A Dominick Cir
- 930 Dominick Cir
- 917B Dillon Way
- 917 Dillon Way Unit B