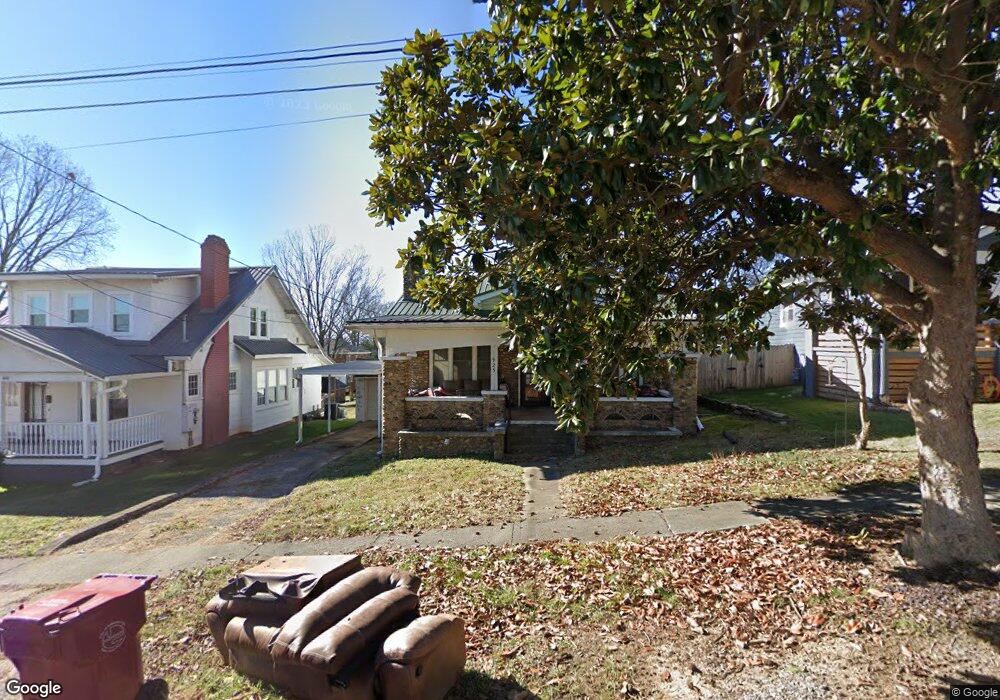
925 E Hillcrest Dr Johnson City, TN 37604
Estimated Value: $197,341 - $333,000
3
Beds
2
Baths
1,700
Sq Ft
$150/Sq Ft
Est. Value
About This Home
This home is located at 925 E Hillcrest Dr, Johnson City, TN 37604 and is currently estimated at $254,585, approximately $149 per square foot. 925 E Hillcrest Dr is a home located in Washington County with nearby schools including North Side Elementary School, Liberty Bell Middle School, and Science Hill High School.
Ownership History
Date
Name
Owned For
Owner Type
Purchase Details
Closed on
May 2, 2025
Sold by
Murray Ronald Shane and Murray Robin
Bought by
Mary C Stevens Revocable Living Trust and Stevens
Current Estimated Value
Purchase Details
Closed on
Nov 14, 2024
Sold by
Britton Robin
Bought by
Murray Ronald and Murray Robin
Purchase Details
Closed on
Sep 30, 2010
Sold by
Murray Ronald Shane
Bought by
Britton Robin
Home Financials for this Owner
Home Financials are based on the most recent Mortgage that was taken out on this home.
Original Mortgage
$85,000
Interest Rate
4.36%
Purchase Details
Closed on
Apr 30, 2010
Sold by
Faust Peggy-Jeanne
Bought by
Murray Ronald Shane
Home Financials for this Owner
Home Financials are based on the most recent Mortgage that was taken out on this home.
Original Mortgage
$30,240
Interest Rate
5.06%
Purchase Details
Closed on
Jun 7, 2004
Sold by
Preston William Frank
Bought by
Ford Reba J
Purchase Details
Closed on
Feb 11, 1998
Sold by
Faust Peggy Jeanne
Bought by
Siele John R and Siele Melissa
Create a Home Valuation Report for This Property
The Home Valuation Report is an in-depth analysis detailing your home's value as well as a comparison with similar homes in the area
Purchase History
| Date | Buyer | Sale Price | Title Company |
|---|---|---|---|
| Mary C Stevens Revocable Living Trust | $220,000 | None Listed On Document | |
| Murray Ronald | -- | None Listed On Document | |
| Britton Robin | $40,300 | -- | |
| Murray Ronald Shane | $37,800 | -- | |
| Ford Reba J | $85,000 | -- | |
| Siele John R | -- | -- |
Source: Public Records
Mortgage History
| Date | Status | Borrower | Loan Amount |
|---|---|---|---|
| Previous Owner | Siele John R | $85,000 | |
| Previous Owner | Siele John R | $30,240 |
Source: Public Records
Tax History
| Year | Tax Paid | Tax Assessment Tax Assessment Total Assessment is a certain percentage of the fair market value that is determined by local assessors to be the total taxable value of land and additions on the property. | Land | Improvement |
|---|---|---|---|---|
| 2025 | $954 | $55,775 | $5,000 | $50,775 |
| 2024 | $954 | $55,775 | $5,000 | $50,775 |
| 2023 | $557 | $25,900 | $0 | $0 |
| 2022 | $557 | $25,900 | $3,525 | $22,375 |
| 2021 | $1,005 | $25,900 | $3,525 | $22,375 |
| 2020 | $1,000 | $25,900 | $3,525 | $22,375 |
| 2019 | $479 | $25,900 | $3,525 | $22,375 |
| 2018 | $859 | $20,125 | $2,350 | $17,775 |
| 2017 | $859 | $20,125 | $2,350 | $17,775 |
| 2016 | $877 | $20,125 | $2,350 | $17,775 |
| 2015 | $794 | $20,625 | $2,350 | $18,275 |
| 2014 | $742 | $20,625 | $2,350 | $18,275 |
Source: Public Records
Map
Nearby Homes
- 916 E Hillcrest Dr
- 603 Stanley Ave
- 611 Fall St
- 518 Stanley Ave
- 516 Stanley Ave
- 826 Polk Ave
- 1015 Knob Creek Rd
- 1308 Knob Creek Rd
- 204 Delaware St
- 410 W 8th Ave
- 909 Millercrest Dr
- 1533 Pactolas Rd Unit 103
- 1533 Pactolas Rd Unit 102
- 1533 Pactolas Rd Unit 106
- 1533 Pactolas Rd Unit 105
- 1533 Pactolas Rd Unit 104
- 705 Lehigh St
- 1412 Knob Creek Rd
- 319 W Chilhowie Ave
- 304 W Chilhowie Ave
- 923 E Hillcrest Dr
- 923 E Hillcrest Dr Unit 2
- 923 E Hillcrest Dr Unit 1
- 927 E Hillcrest Dr
- 921 E Hillcrest Dr
- 924 W Hillcrest Dr
- 926 E Hillcrest Dr
- 920 W Hillcrest Dr
- 922 E Hillcrest Dr
- 917 E Hillcrest Dr
- 918 W Hillcrest Dr
- 920 E Hillcrest Dr
- 300 Peachtree St
- 304 Peachtree St
- 212 Peachtree St
- 916 W Hillcrest Dr
- 209 Peachtree St
- 915 E Hillcrest Dr
- 306 Peachtree St
- 210 Peachtree St
Your Personal Tour Guide
Ask me questions while you tour the home.