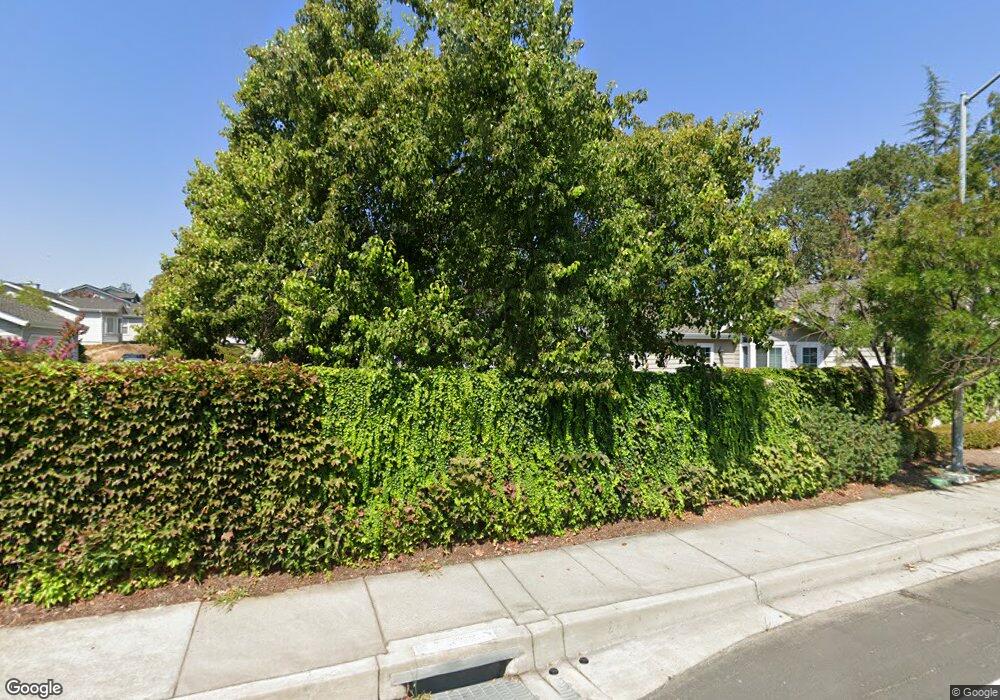
926 Clinton Place Pleasanton, CA 94566
Estimated Value: $1,002,000 - $1,372,698
3
Beds
2
Baths
1,587
Sq Ft
$776/Sq Ft
Est. Value
About This Home
This home is located at 926 Clinton Place, Pleasanton, CA 94566 and is currently estimated at $1,231,175, approximately $775 per square foot. 926 Clinton Place is a home located in Alameda County with nearby schools including Valley View Elementary School, Pleasanton Middle School, and Amador Valley High School.
Ownership History
Date
Name
Owned For
Owner Type
Purchase Details
Closed on
Aug 24, 2020
Sold by
Zampierin Paul A
Bought by
Cordtz Brandon
Current Estimated Value
Home Financials for this Owner
Home Financials are based on the most recent Mortgage that was taken out on this home.
Original Mortgage
$510,000
Outstanding Balance
$451,562
Interest Rate
2.9%
Mortgage Type
New Conventional
Estimated Equity
$779,613
Purchase Details
Closed on
Aug 23, 2020
Sold by
Cordtz Taylor
Bought by
Cordtz Brandon
Home Financials for this Owner
Home Financials are based on the most recent Mortgage that was taken out on this home.
Original Mortgage
$510,000
Outstanding Balance
$451,562
Interest Rate
2.9%
Mortgage Type
New Conventional
Estimated Equity
$779,613
Purchase Details
Closed on
May 8, 1998
Sold by
Unternahrer Josef R
Bought by
Zampierin Giovanni and Zampierin Emma
Create a Home Valuation Report for This Property
The Home Valuation Report is an in-depth analysis detailing your home's value as well as a comparison with similar homes in the area
Home Values in the Area
Average Home Value in this Area
Purchase History
| Date | Buyer | Sale Price | Title Company |
|---|---|---|---|
| Cordtz Brandon | $850,000 | Wfg National Title Ins Co | |
| Zampierin Paul A | -- | Wfg National Title Ins Co | |
| Cordtz Brandon | -- | Wfg National Title Ins Co | |
| Zampierin Giovanni | $315,000 | Financial Title Company |
Source: Public Records
Mortgage History
| Date | Status | Borrower | Loan Amount |
|---|---|---|---|
| Open | Cordtz Brandon | $510,000 |
Source: Public Records
Tax History Compared to Growth
Tax History
| Year | Tax Paid | Tax Assessment Tax Assessment Total Assessment is a certain percentage of the fair market value that is determined by local assessors to be the total taxable value of land and additions on the property. | Land | Improvement |
|---|---|---|---|---|
| 2025 | $10,642 | $920,057 | $378,847 | $541,210 |
| 2024 | $10,642 | $902,020 | $371,420 | $530,600 |
| 2023 | $10,520 | $884,340 | $364,140 | $520,200 |
| 2022 | $9,967 | $867,000 | $357,000 | $510,000 |
| 2021 | $9,712 | $850,000 | $350,000 | $500,000 |
| 2020 | $3,394 | $299,715 | $31,318 | $268,397 |
| 2019 | $3,432 | $293,840 | $30,704 | $263,136 |
| 2018 | $3,362 | $288,079 | $30,102 | $257,977 |
| 2017 | $3,276 | $282,432 | $29,512 | $252,920 |
| 2016 | $3,019 | $276,896 | $28,934 | $247,962 |
| 2015 | $2,962 | $272,737 | $28,499 | $244,238 |
| 2014 | $3,013 | $267,396 | $27,941 | $239,455 |
Source: Public Records
Map
Nearby Homes
- 786 Bonita Ave
- 789 E Angela St
- 4253 Mirador Dr
- 601 Palomino Dr Unit C
- 665 Palomino Dr Unit D
- 3550 Arbor Ct
- 1312 Vintner Way
- 588 E Angela St
- 3399 Norton Way Unit 6
- 3379 Arbor Dr
- 3375 Norton Way Unit 5
- 543 Tawny Dr
- 4525 Entrada Ct
- 262 Birch Creek Dr
- 526 Malbec Ct
- 373 Linden Way
- 236 Birch Creek Terrace Unit 14
- 3845 Vineyard Ave Unit F
- 3937 Vine St
- 3841 Vineyard Ave Unit 18
- 918 Clinton Place
- 934 Clinton Place
- 910 Clinton Place
- 942 Clinton Place
- 1073 Kottinger Dr
- 921 Clinton Place
- 1055 Kottinger Dr
- 958 Clinton Place
- 3901 Bernal Ave
- 950 Clinton Place
- 902 Clinton Place
- 905 Clinton Place
- 1031 Kottinger Dr
- 961 Clinton Place
- 966 Clinton Place
- 4036 Sherry Ct
- 967 Clinton Place
- 974 Clinton Place
- 4048 Sherry Ct
- 1109 Kottinger Dr