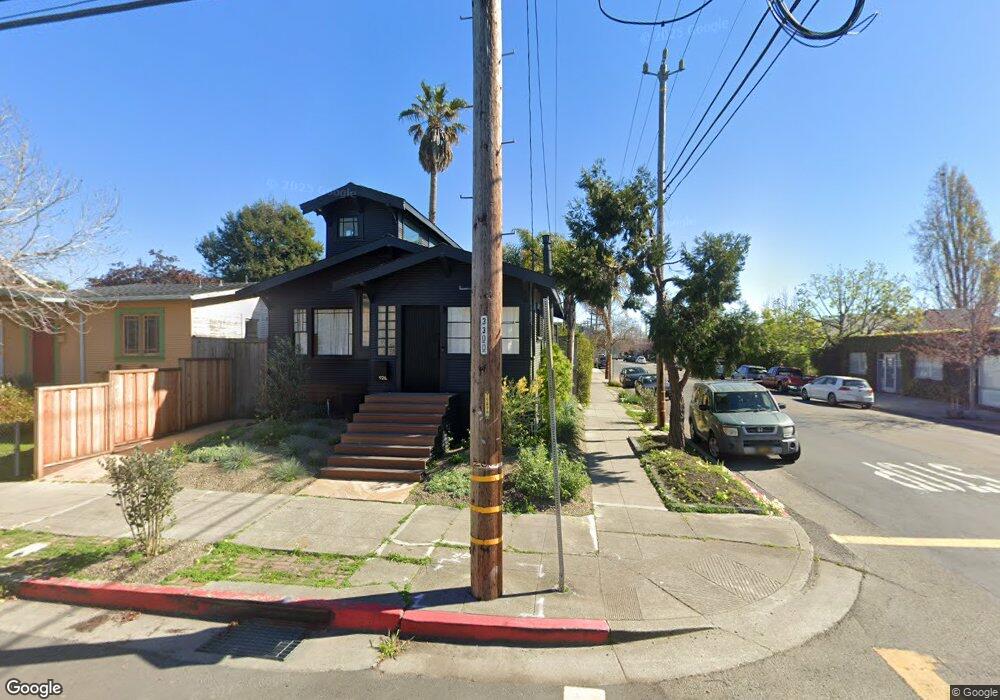
926 Grayson St Berkeley, CA 94710
West Berkeley NeighborhoodEstimated Value: $1,001,000 - $1,081,000
2
Beds
1
Bath
1,006
Sq Ft
$1,042/Sq Ft
Est. Value
About This Home
This home is located at 926 Grayson St, Berkeley, CA 94710 and is currently estimated at $1,048,630, approximately $1,042 per square foot. 926 Grayson St is a home located in Alameda County with nearby schools including Oxford Elementary School, Malcolm X Elementary School, and Washington Elementary School.
Ownership History
Date
Name
Owned For
Owner Type
Purchase Details
Closed on
Jun 22, 2022
Sold by
Stephen Anderson Jr James
Bought by
James S Anderson Jr Trust
Current Estimated Value
Purchase Details
Closed on
Sep 10, 2019
Sold by
Swing Carrie A and Sally V Swing Trust
Bought by
Anderson James Stephen and Schubert Samantha Julia
Home Financials for this Owner
Home Financials are based on the most recent Mortgage that was taken out on this home.
Original Mortgage
$743,750
Interest Rate
3.7%
Mortgage Type
New Conventional
Purchase Details
Closed on
Dec 28, 2018
Sold by
Swing Sally V
Bought by
Swing Carrie A and Sally V Swing Trust
Create a Home Valuation Report for This Property
The Home Valuation Report is an in-depth analysis detailing your home's value as well as a comparison with similar homes in the area
Home Values in the Area
Average Home Value in this Area
Purchase History
| Date | Buyer | Sale Price | Title Company |
|---|---|---|---|
| James S Anderson Jr Trust | -- | Lafranchi Law Office | |
| Anderson James Stephen | $875,000 | Old Republic Ttl Co Montclai | |
| Swing Carrie A | -- | None Available |
Source: Public Records
Mortgage History
| Date | Status | Borrower | Loan Amount |
|---|---|---|---|
| Previous Owner | Anderson James Stephen | $743,750 |
Source: Public Records
Tax History
| Year | Tax Paid | Tax Assessment Tax Assessment Total Assessment is a certain percentage of the fair market value that is determined by local assessors to be the total taxable value of land and additions on the property. | Land | Improvement |
|---|---|---|---|---|
| 2025 | $13,715 | $956,926 | $519,474 | $437,452 |
| 2024 | $13,715 | $938,166 | $509,290 | $428,876 |
| 2023 | $13,391 | $919,773 | $499,305 | $420,468 |
| 2022 | $13,131 | $901,740 | $489,516 | $412,224 |
| 2021 | $13,187 | $884,065 | $479,921 | $404,144 |
| 2020 | $12,628 | $875,000 | $475,000 | $400,000 |
| 2019 | $5,407 | $301,808 | $90,542 | $211,266 |
| 2018 | $5,296 | $295,891 | $88,767 | $207,124 |
| 2017 | $5,092 | $290,091 | $87,027 | $203,064 |
| 2016 | $4,909 | $284,403 | $85,321 | $199,082 |
| 2015 | $4,833 | $280,131 | $84,039 | $196,092 |
| 2014 | $4,783 | $274,645 | $82,393 | $192,252 |
Source: Public Records
Map
Nearby Homes
- 1010 Grayson St
- 1034 Grayson St
- 2751 Wallace St
- 1237 Ashby Ave
- 811 Folger Ave
- 2717 Mabel St
- 1092 Dwight Way
- 1118 Dwight Way
- 3032 Mabel St
- 1142 Dwight Way
- 1314 Ashby Ave
- 1144 Dwight Way
- 1080 67th St
- 2411 Sixth St
- 1200 65th St Unit 224
- 1200 65th St Unit 230
- 917 Channing Way
- 2341 9th St
- 6501 San Pablo Ave Unit 410
- 1039 Channing Way
Your Personal Tour Guide
Ask me questions while you tour the home.